As we have just learned, there are many different factors that interact to produce the various climates observed on our planet’s surface. These interactions often create situations in which locations separated by great distances can have comparable climates. Case in point, the climate of much of California is similar to that of extensive parts of Italy. Both of these regions have a climate that is frequently described as being Mediterranean.
The ancient Greeks were the first to identify the fact that different locations can have similar climates. The Greeks recognized that areas to the south of the Mediterranean were much hotter and drier than the area they inhabited and frequently visited because of trade (roughly between 45 and 35° N latitude). They also knew that the area north of their homelands had a much cooler climate, especially in winter. Considering these observations, the ancient Greeks developed a classification scheme with three climate zones: Torrid, Temperate, and Frigid (Figure 9.4).
Over the centuries, as exploration revealed new information about our planet, the Greek classification system was modified into a variety of more complex systems. Many of these systems suggested five to six broad climate types (Figure 9.5). In the early 20th century, the German scientist Wladimir Köppen published a climate classification system that became widely accepted and employed. The first form of his climate classification system appeared in 1918. Köppen continued to refine his system for almost two decades, with the final version published in 1936. Today, a somewhat modified Köppen system is still the most popular method for classifying climate.
Köppen Climate Classification System
As previously mentioned, the Köppen Climate Classification System is the most widely used system for classifying the climates of places on our planet. This system classifies a location’s climate mainly using annual and monthly averages of temperature and precipitation. A version of the Köppen system is presented in Appendix 2 and plotted on a map in Figure 9.6. This modified Köppen-Geiger system includes up to three levels of classification based primarily on temperature and precipitation information. The first level recognizes six major climatic types, each designated by a capital letter. These major climate categories have the following broad characteristics:
- A - Tropical Moist Climates: These are very warm climates found in the tropics that experience high quantities of precipitation. The primary distinguishing characteristic of these climates is that all months have average temperatures above 18°C (64°F).
- B - Dry Climates: These climates experience little precipitation for most of the year. Further, potential water losses from evaporation and transpiration greatly exceed the atmospheric input of precipitation.
- C - Moist Mid-Latitude Climates with Mild Winters: In these climates, summer temperatures are warm to hot, and winters are mild. The primary distinguishing characteristic of these climates is that the coldest month has an average temperature between 18°C (64°F) and -3°C (27°F).
- D - Moist Mid-Latitude Climates with Cold Winters: In these climates, summers are warm, and winters are cold. The primary distinguishing characteristic of these climates is that the average temperature of the warmest month exceeds 10°C (50°F), and the average temperature of the coldest month is below -3°C (27°F).
- E - Polar Climates: These climates have very cold winters and cold summers, with no real summer season. The primary distinguishing characteristic of these climates is that the warmest month has an average temperature below 10°C (50°F).
- H - Highland Climates: These are climates strongly influenced by altitude. As a result, the climate of such locations is quite different from that of low-elevation areas at similar latitudes.
At the secondary level, the major climate groups are further subdivided according to the seasonal distribution of precipitation, the degree of aridity, or the presence/absence of permanent ice (Appendix 2). Lowercase letters f, w, and s are used to distinguish precipitation patterns and are only applicable to A, C, and D climates. Uppercase W and S identify desert (arid) or steppe (semiarid) climate subtypes for the Dry Climates (B) major category. For the Polar Climates (E), the secondary letters F and T distinguish whether the site is covered by permanent ice fields and glaciers or free of snow and ice during the summer season.
Major climate types B, C, and D can be further subdivided into a third category (Appendix 2). This level is used to distinguish particular temperature characteristics found in these climates. InBclimates, the lowercase letterhidentifies a subtropical location where the average annual temperature is above 18°C (64°F). Cooler mid-latitude Dry Climates are distinguished with a lowercase k. For C and D climates, the tertiary level letters a, b, c, and d are used to distinguish different monthly temperature characteristics.
Tropical Moist Climates - Köppen Type A
Locations with Tropical Moist Climates (A) are often found north and south of the equator, extending to about 15 to 25° latitude (see map, Figure 9.6). In these climates, all months have average temperatures greater than 18°C (64°F). Annual precipitation is usually greater than 1500 mm (59 in). Three second-tier climate types are common in the A group: Tropical wet (Af), tropical wet and dry (Aw), and tropical monsoon (Am).
Tropical Wet (Af)
Tropical wet (Af) climates are generally found in the zone from 5 to 10° of latitude from the equator. In this tropical climate, precipitation is evenly distributed throughout the year. Annual rainfall totals often exceed 2000 mm (80 in). For many Af locations, average annual temperatures are from 22 to 28°C (72 to 82°F). On a typical day, afternoon temperatures reach a high in the low 30s°C (high 80s°F), while daily lows would be in the low 20s°C (low 70s°F), occurring just after sunrise. Seasonal variations in monthly average temperature are slight, normally less than 3°C (5°F). Further, the monthly consistency in both precipitation and temperature produces a tropical climate with no discernible wet and dry seasons. The warm and wet Af climate also promotes the growth of tropical broadleaf forests (Figure 9.7).
Regions experiencing an Af climate lie within the effects of the Intertropical Convergence Zone (ITCZ) during most of the year. These locations are also constantly influenced by very humidmaritime tropical air masses. Because of intense surface heating and the high humidity, cumulus and cumulonimbus clouds form in the afternoons of most days. Thunderstorms account for most of the precipitation in these climates.
The climographs of Paramaribo, Suriname, and Iquitos, Peru, show the temperature and precipitation monthly and annual data for two typical Af climates (Figure 9.8). In both locations, none of the average monthly temperatures fall below 25°C (77°F). On a seasonal basis, the average monthly temperatures fluctuate by less than 3°C (5°F) throughout the year. Greater month-to-month variation is seen in precipitation averages. Yet even the driest month still receives significant rainfall: 129 mm (5.1 in) in Paramaribo and 163 mm (6.4 in) in Iquitos.
Tropical Wet and Dry (Aw)
The tropical wet and dry climate (Aw) is distinguished from the Af climate described above by having distinct wet and dry seasons. It also supports a biome type with a mixture of grassland and trees known as savanna (Figure 9.9). The Aw climate is found in extensive areas in South America, Africa, and southern Asia, and in smaller regions in northern Australia and Central America (see map Figure 9.6).
The wet or high-sun (summer) season in these climates occurs when the ITCZ migrates into the region (see Figure 9.1). The ITCZ is associated with humid maritime tropical air masses and extreme surface heating. Together, these conditions lead to frequent thunderstorm development. Precipitation during the wet season is usually less than 1000 mm. The dry period occurs during the winter or low Sun season. During the dry season, atmospheric conditions become more stable because of upper-air subsidence and the dominance of drier continental tropical air masses. The development of these atmospheric conditions is connected to the seasonal migration of the Subtropical High Pressure Zone (see Figure 9.1).
As the climographs for Calcutta and Cuiaba (Figure 9.10) indicate, the average annual temperatures of Aw climates are very similar to Af climates (see Figure 9.8). Variations in monthly average temperature tend to be greater in Aw climates because of stronger heating during the dry season.
Tropical Monsoon (Am)
The abbreviation Am identifies a tropical monsoon climate. The geographic distribution of this climate type is somewhat limited, found on the windward coasts of India, Myanmar, and Thailand, and in small areas in western Africa, the Philippines, and northeastern South America. Like the tropical wet and dry (Aw) climate, distinct wet and dry seasons exist because of the alternating presence of the ITCZ or Subtropical High Pressure Zone. What makes theAmclimate different from theAwclimate is the quantity of precipitation that falls during the rainy season. In atropical monsoonclimate, annual rainfall is equal to or greater than in a typical tropical wet climate (Figure 9.11). The additional precipitation observed at Am locations is due to the development of the summer monsoon circulation. During the winter monsoon, rainfall is scarce for several months.
Dry Climates - Köppen Type B
Dry Climates (B) generally extend from 20 - 35° North and South of the equator. B climates are also found in large continental regions of the mid-latitudes, often in association with mountains (see Figure 9.6). The most obvious characteristic of this climate type is that precipitation does not meet the water needs of potential evaporation and transpiration. Two second-tier types of this climate exist, differing in their water deficiency.
- Desert (BW) - This is an arid desert climate that is dominated by xerophytic vegetation (Figure 9.12). In some locations experiencing this climate type, like parts of the Sahara Desert in Africa, conditions are so arid that the landscape is devoid of plants.
- Steppe (BS) - This is a semiarid climate dominated by grassland vegetation. The BS climate receives more precipitation than the BW, either from the ITCZ or from mid-latitude cyclones.
Both of these B climate types can be further classified at a tertiary level. This level of sorting is based on temperature characteristics (Appendix 2). Locations with an average annual temperature of 18°C or greater are considered subtropical and are assigned the tertiary designation h. If the average annual temperature is less than 18°C, a mid-latitude climate exists, and a tertiary label k is used.
Subtropical Desert (BWh) and Steppe (BSh)
Combined, subtropical desert (BWh) and subtropical steppe (BSh) climate types cover about 25% of all land area on the continents (see Figure 9.6). Both climates are dominated by dry continental tropical air masses all year. Some other common weather characteristics associated with these climates include:
- Low atmospheric humidity and clear skies.
- Low frequency and quantity of precipitation.
- Average annual temperature greater than 18°C (64°F).
- High average monthly temperatures.
- Extreme diurnal temperature ranges.
- Relatively strong winds.
The subtropical desert (BWh) climates are generally found near the tropics of Cancer and Capricorn, often on the western side of continents (see Figure 9.6). Places with this climate are strongly influenced by upper-air stability and subsidence, which result from the presence of the Subtropical High Pressure Zone. The relative humidity is often low, averaging 10 to 30% for inland locations. Precipitation is very low in quantity and very infrequent. The highest monthly average temperatures on Earth can be found in this climate type. These average monthly temperatures can reach 35°C (95°F). Winter monthly average temperatures can be 15 to 25°C (27 to 45°F) cooler than summer maximums.
Figure 9.13 describes the climographs of two typical BWh climates: Luxor, Egypt, and Alice Springs, Australia. BWh climates also have extreme diurnal temperature ranges. Daytime temperatures rise rapidly because clear skies allow maximum transmission of solar insolation to the ground, where it is converted into sensible heat. At night, air temperatures drop quickly because low atmospheric humidity causes uninterrupted transmission of longwave radiation from the ground and lower atmosphere back to space. In high-humidity climates, water vapor absorbs most of the upward longwave radiation emitted by the Earth. This energy is then reradiated back to the Earth’s surface, again creating heat energy.
Subtropical steppe (BSh) climates are normally found bordering regions of subtropical desert climate (BKh) (see Figure 9.6). The most obvious difference between BSh and BWh climates is the precipitation levels. Subtropical steppe climates receive much of their precipitation from thunderstorm activity. Poleward margin regions of this climate can also receive precipitation by way of winter excursions of the mid-latitude cyclone. BSh climates receive enough precipitation to support the growth of grassland plants. Figure 9.14 describes the climographs of two typical BSh locations: Monterrey, Mexico and Bulawayo, Zimbabwe. Comparing these locations to the previously described BWh climographs (Figure 9.13) indicates similar temperature regimes but different precipitation characteristics.
Mid-Latitude Desert (BWk) and Steppe (BSk)
Mid-latitude desert (BWk) and mid-latitude steppe (BSk) climates are dry due to extreme continentality and the effect of high elevation. Subsiding air only plays a secondary role in creating arid and semiarid conditions. Being located at the center of a continent reduces the amount of moisture available from ocean sources. With limited moisture, precipitation is low in quantity. The presence of mountains upwind of these climates can further reduce moisture availability because of the rainshadow effect. These climates tend to be dominated by continental tropical air masses during summer and continental polar air masses in winter.
Major expanses of the mid-latitude deserts (BWk) can be found east of the Caspian Sea, north of the Himalayas, in the western United States, and east of the Andes in a narrow region in southern South America (see Figure 9.6). BWk climates have a greater range of both daily and annual temperatures than their subtropical counterparts (Figure 9.15). In most cases, summer temperatures are not as high in mid-latitude deserts when compared tosubtropical deserts. But there are exceptions, like Death Valley, California, one of the hottest places on our planet. Winter temperatures in mid-latitude deserts are generally quite cool, with varying periods of below-freezing temperatures. Mid-latitude steppe (BSk) climates cover considerable parts of western North America and central Asia. This climate normally has temperature characteristics comparable to mid-latitude deserts (see Figures 9.15 and 9.16). BSk climates do receive slightly more precipitation than mid-latitude deserts.
Moist Mid-Latitude Climates with Mild Winters - Köppen Type C
C climates generally have warm, humid summers and mild winters. The geographic extent of this climate is generally from 25 to 55° of latitude, mainly along the eastern and western borders of continents (see Figure 9.6). During the winter months, the main weather feature is the mid-latitude cyclone. Convective thunderstorms are quite common in the summer months. Regions near the coast with a C climate can also receive significant precipitation from hurricanes. While a number of minor climates exist in this group, we will focus this discussion on three common subtypes: Cf - humid subtropical, Cs –Mediterranean, and Cw – dry winter, wet summer.
Humid Subtropical (Cf)
The humid subtropical (Cf) climate is found in the Northern Hemisphere, from 25° to 40° N, mainly along the eastern margins of continents and along the western continental margins from 40° to 60° N (see Figure 9.6). In the Southern Hemisphere, this climate occurs on the southeastern tip of South America, in New Zealand, and along the southeast coast of Australia.
Three tertiary Cf climate types are common: Cfa, Cfb, and Cfc. The Cfa subgroup of the humid subtropical climate has hot, humid summers with frequent thunderstorms. These conditions arise because of the summer dominance of maritime tropical air masses. The southeast regions of the United States and China average about 40 to 60 thunderstorm days per year. Winters are mild, and precipitation during this season is driven by mid-latitude cyclones. Figure 9.17 shows the climatic characteristics of two typical Cfa climates: Atlanta, Georgia, USA, and Buenos Aires, Argentina. Cfa locations are influenced by winds coming off the oceans. This condition makes winter temperatures much milder than those in inland locations at the same latitude. Precipitation is evenly distributed throughout the year, with annual totals typically between 800 and 1650 mm (31 and 65 in).
Cfb and Cfc climates are typically found along the western edges of continents at middle latitudes. These climates have a humid climate with a short dry summer. Frequent precipitation occurs during the mild winters due to the repeated occurrence of mid-latitude cyclones. Climographs for two typical Cfb climates are illustrated in Figure 9.18. Summer average monthly temperatures are normally between 16 and 21°C (60 to 70°F). In winter, the average temperature is between 2 and 7°C (35 to 45°F). Cfc climates are found poleward of Cfb climates. Cfc climates also have fewer than 4 months with average temperatures above 10°C (50°F).
Dry Winter, Wet Summer (Cw)
The Cw climate is distinguished by an obvious seasonal pattern of both temperature and precipitation. This climate typically occurs in the interiors of continents at the middle latitudes. In the summer months, maritime tropical air masses significantly influence the weather. Sporadically, these moist air masses are displaced by drier continental tropical air masses from adjacent deserts. Summers are hot and humid, with intense summer thunderstorms. Continental polar air masses are common in winter. The continental polar air masses produce cold, dry weather. Mid-latitude cyclones, coupled with moist, maritime polar air, occasionally occur in the winter, providing only a small quantity of precipitation. The most common variant of this climate is the Cwa (Appendix 2). Figure 9.19 shows the climographs of two Cwa climates: Omaha, Nebraska, USA, and Guangzhou, China.
Mediterranean (Cs)
The mid-latitude Mediterranean (Cs) climate is found on the western edge of the continents between 30 and 40° of latitude. Usually, this climate does not extend very far into the interior of continents. This climate generally has a summer with infrequent precipitation. Summer weather is influenced by continental tropical air, which produces dry, warm conditions (Figure 9.20). Average summer monthly temperatures range from about 20 to 25°C (68 to 77°F). Winter average monthly temperatures are well above 0°C (32°F), and freezing temperatures are a rare event. Precipitation falls mainly in the winter in this climate because of mid-latitude cyclones and associated maritime polar air masses. Locations in North America are from Portland, Oregon to all of California.
Moist Mid-Latitude Climates with Cold Winters - Köppen Type D
Moist mid-latitude climates with cold winters (D) have warm to cool summers and cold winters. These climates are poleward of the C climates, at about 50 to 70° N latitude (Figure 9.6). This climate type is essentially absent from the Southern Hemisphere because little landmass lies in the 50 to 70° S latitude zone. The average temperature of the warmest month is greater than 10°C (50°F), while the coldest month is less than -3°C (27°F). Winters are severe, with snowstorms, strong winds, and bitterly cold temperatures associated with continental polar air masses or continental arctic air masses. Precipitation in D climates is usually the result of summer thunderstorms or the action of mid-latitude cyclones during all seasons. Two minor categories are quite common: Df - wet all seasons and Dw - dry winters.
Figure 9.21 shows the climograph of Winnipeg, Canada, a typical Df climate. Note the extreme variation in the annual temperature range and the severity of the winter temperatures. Winnipeg’s climate would be classified as Dfb at the tertiary level (Appendix 2) because it has at least 4 months with temperatures above 10°C (50°C). Figure 9.22 describes the climograph of Calgary, Canada, which has a distinct dry winter (Dw) climate. Calgary’s dry winter is a product of its closeness to the western North American mountain belts. These mountains enhance the development of stable high-pressure systems during winter in this region. According to Appendix 2, Calgary’s complete three-letter classification would be Dwb.
Polar Climates - Köppen Type E
Polar climates have year-round cold temperatures, with the warmest month less than 10°C (50°F). Polar climates are found in the northern coastal areas of North America, Europe, and Asia and on the landmasses of Greenland and Antarctica (see Figure 9.6). Two minor climate types exist: polar tundra (ET) and polar ice cap (EF).
Polar Tundra (ET)
ET or polar tundra climates are characterized by long, cold winters and short, cool summers (Figure 9.23). Annual precipitation averages less than 250 mm (10 in), and most of this precipitation falls during the summer months. Dominant air masses are maritime polar in summer and continental polar or continental arctic in winter. Locations experiencing this climate type often have soils permanently frozen to depths of hundreds of meters (hundreds of feet), a condition called permafrost. Vegetation is dominated by mosses, lichens, dwarf trees, and scattered woody shrubs. Geographically, this climate type is found on the North American Arctic coast, Iceland, coastal Greenland, the Arctic coast of Europe and Asia, and the Southern Hemisphere islands of McQuarie, Kerguelen, and South Georgia.
Polar Ice Cap (EF)
EF or ice cap has a ground surface permanently covered with snow and ice. Areas of our planet with this environmental condition include Greenland and Antarctica. Continental arctic air masses, continental antarctic air masses, and continental polar air masses dominate yearly, producing very cold monthly and annual air temperatures (Figure 9.24). Average monthly temperatures are below 0°C (32°F) for all months. Winds are constant, and the velocity is high enough to regularly produce blizzard conditions. During the winter half of the year, no solar radiation is received. Available insolation is relatively high during the peak summer months because of long days and a reasonably clear atmosphere. However, the albedo of snow-covered surfaces reflects most of this insolation back to space.
Highland Climates - Köppen Type H
Highland (H) climates are defined by the effect altitude has on a location’s climate. As such, these climates are located from the tropics to the poles. The most apparent climate characteristic that is altered in these climates is temperature. Annual and monthly temperatures are lower due to adiabatic cooling and the fact that the atmosphere at high altitudes contains less moisture. A drier atmosphere decreases the amount of heat energy that can be generated by surface absorption of longwave counter-radiation from the atmosphere. This process also enhances nighttime cooling, resulting in quite extreme diurnal temperature ranges. Precipitation in highland climates is sometimes enhanced by the process of orographic uplift. More commonly,Hclimates tend to have lower quantities of precipitation than adjacent low-elevation sites because cold, high-altitude air holds less water vapor, and the rainshadow effect.
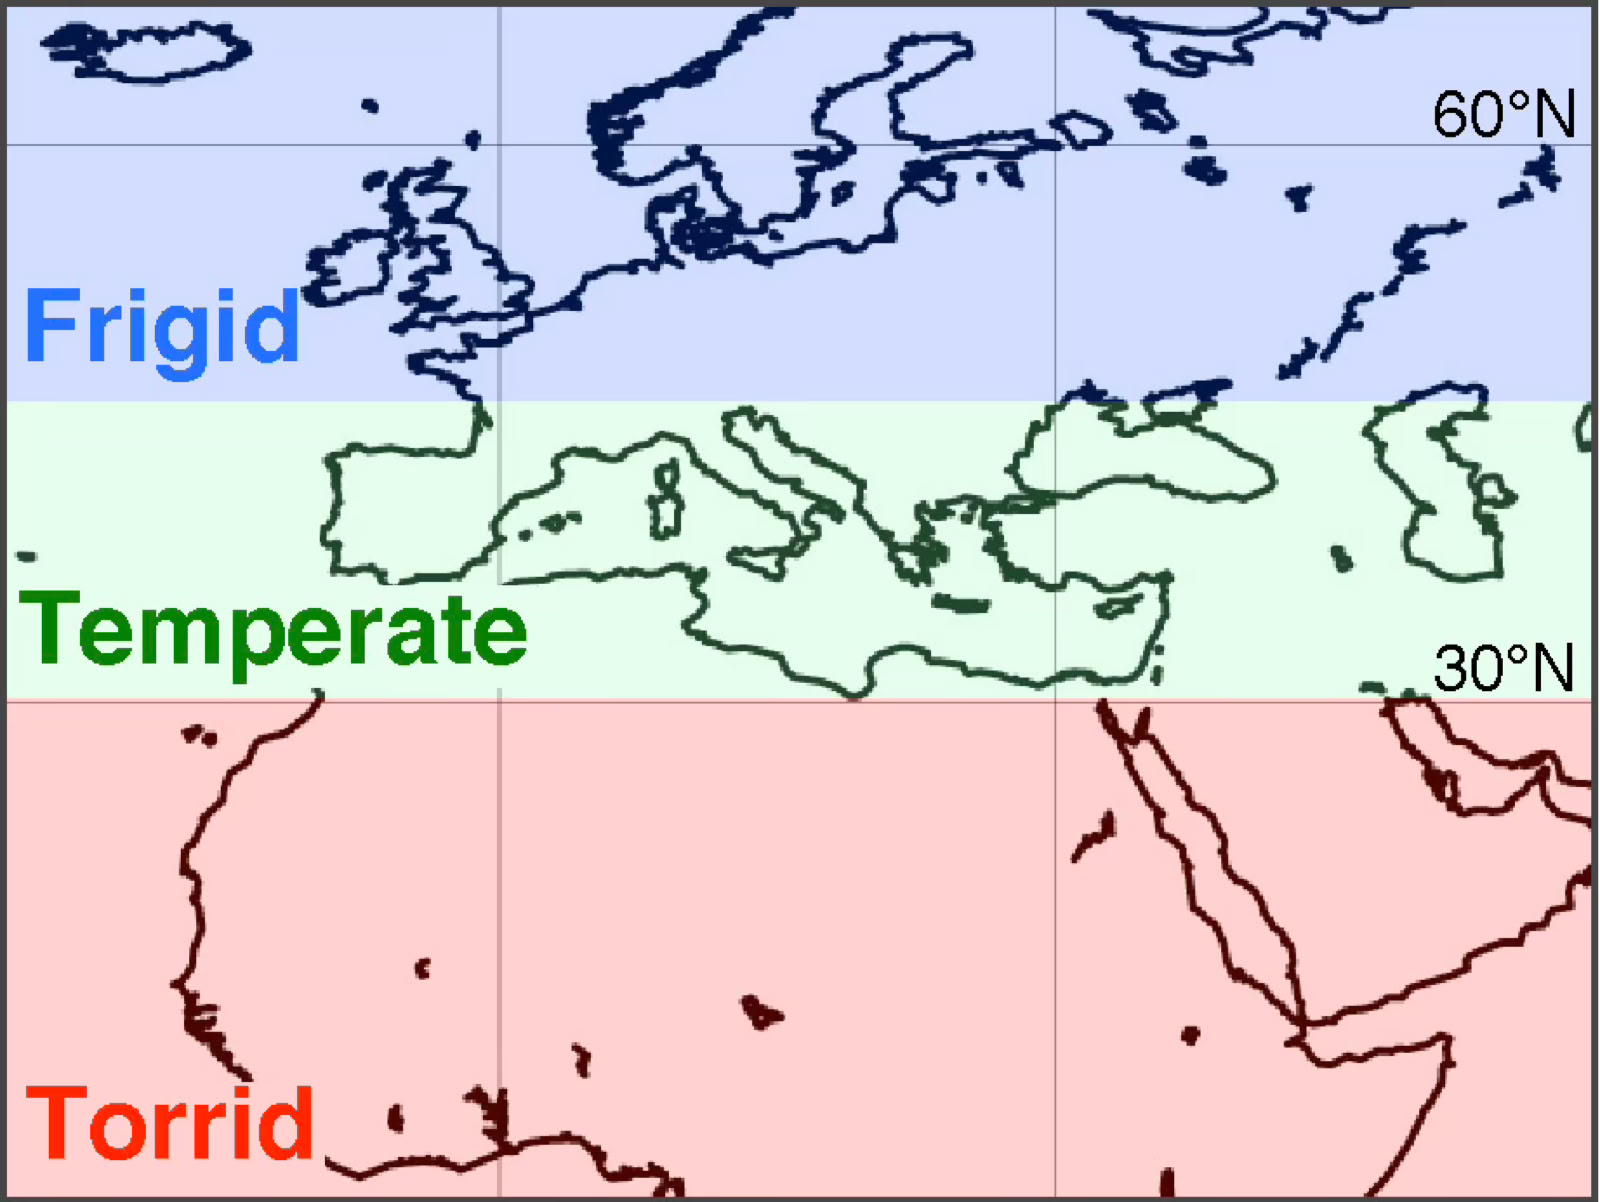
FIGURE 9.4 Simple three-category climate classification system used by the ancient Greeks. Image Copyright: Michael Pidwirny.
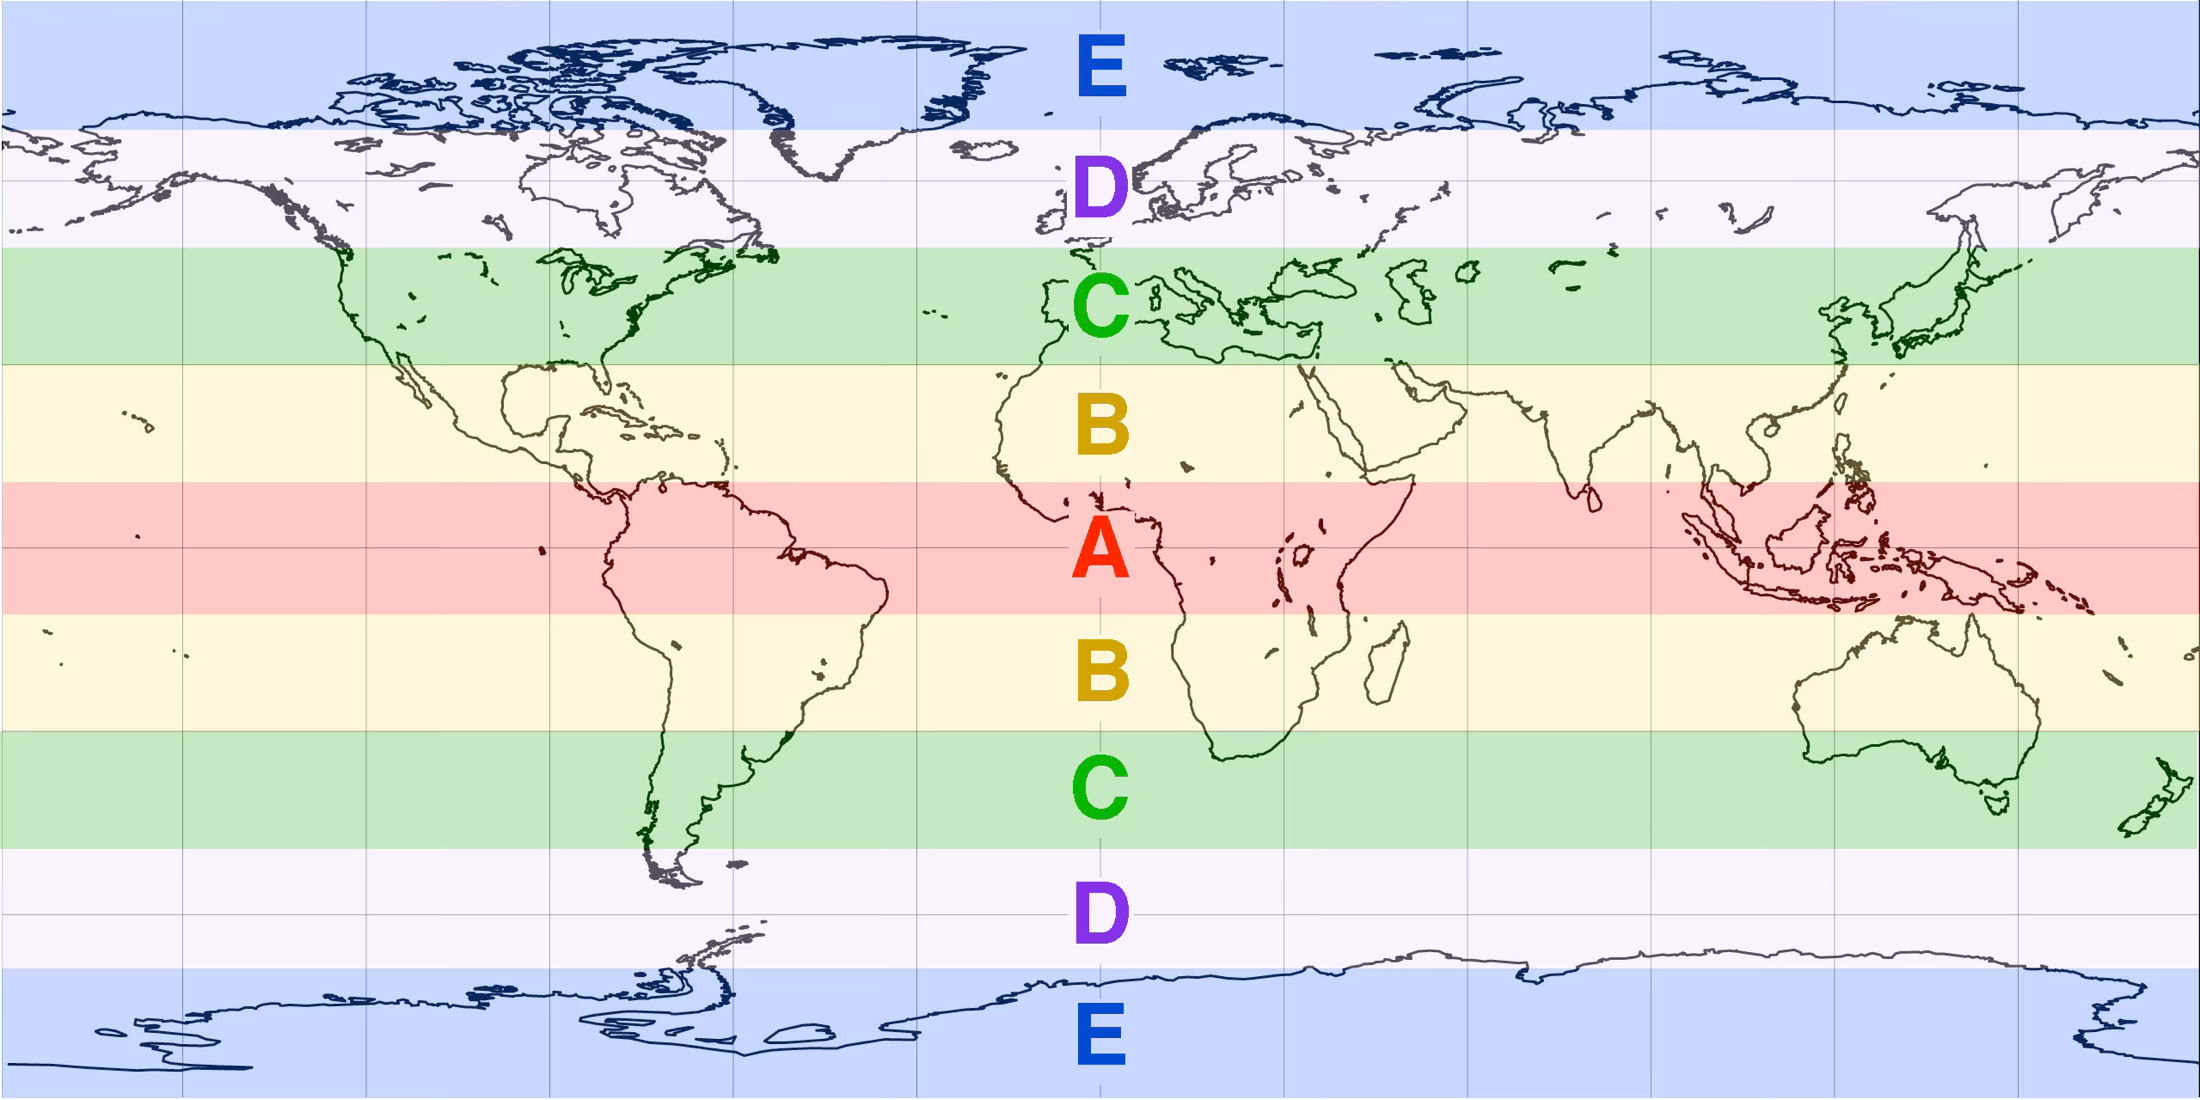
FIGURE 9.5 More complex climate classification system with five categories: (A) tropical hot and moist, (B) tropical/subtropical hot and dry, (C) mid-latitude warm and moist, (D) mid-latitude cold and moist, and (E) high latitude cold and dry. Image Copyright: Michael Pidwirny.
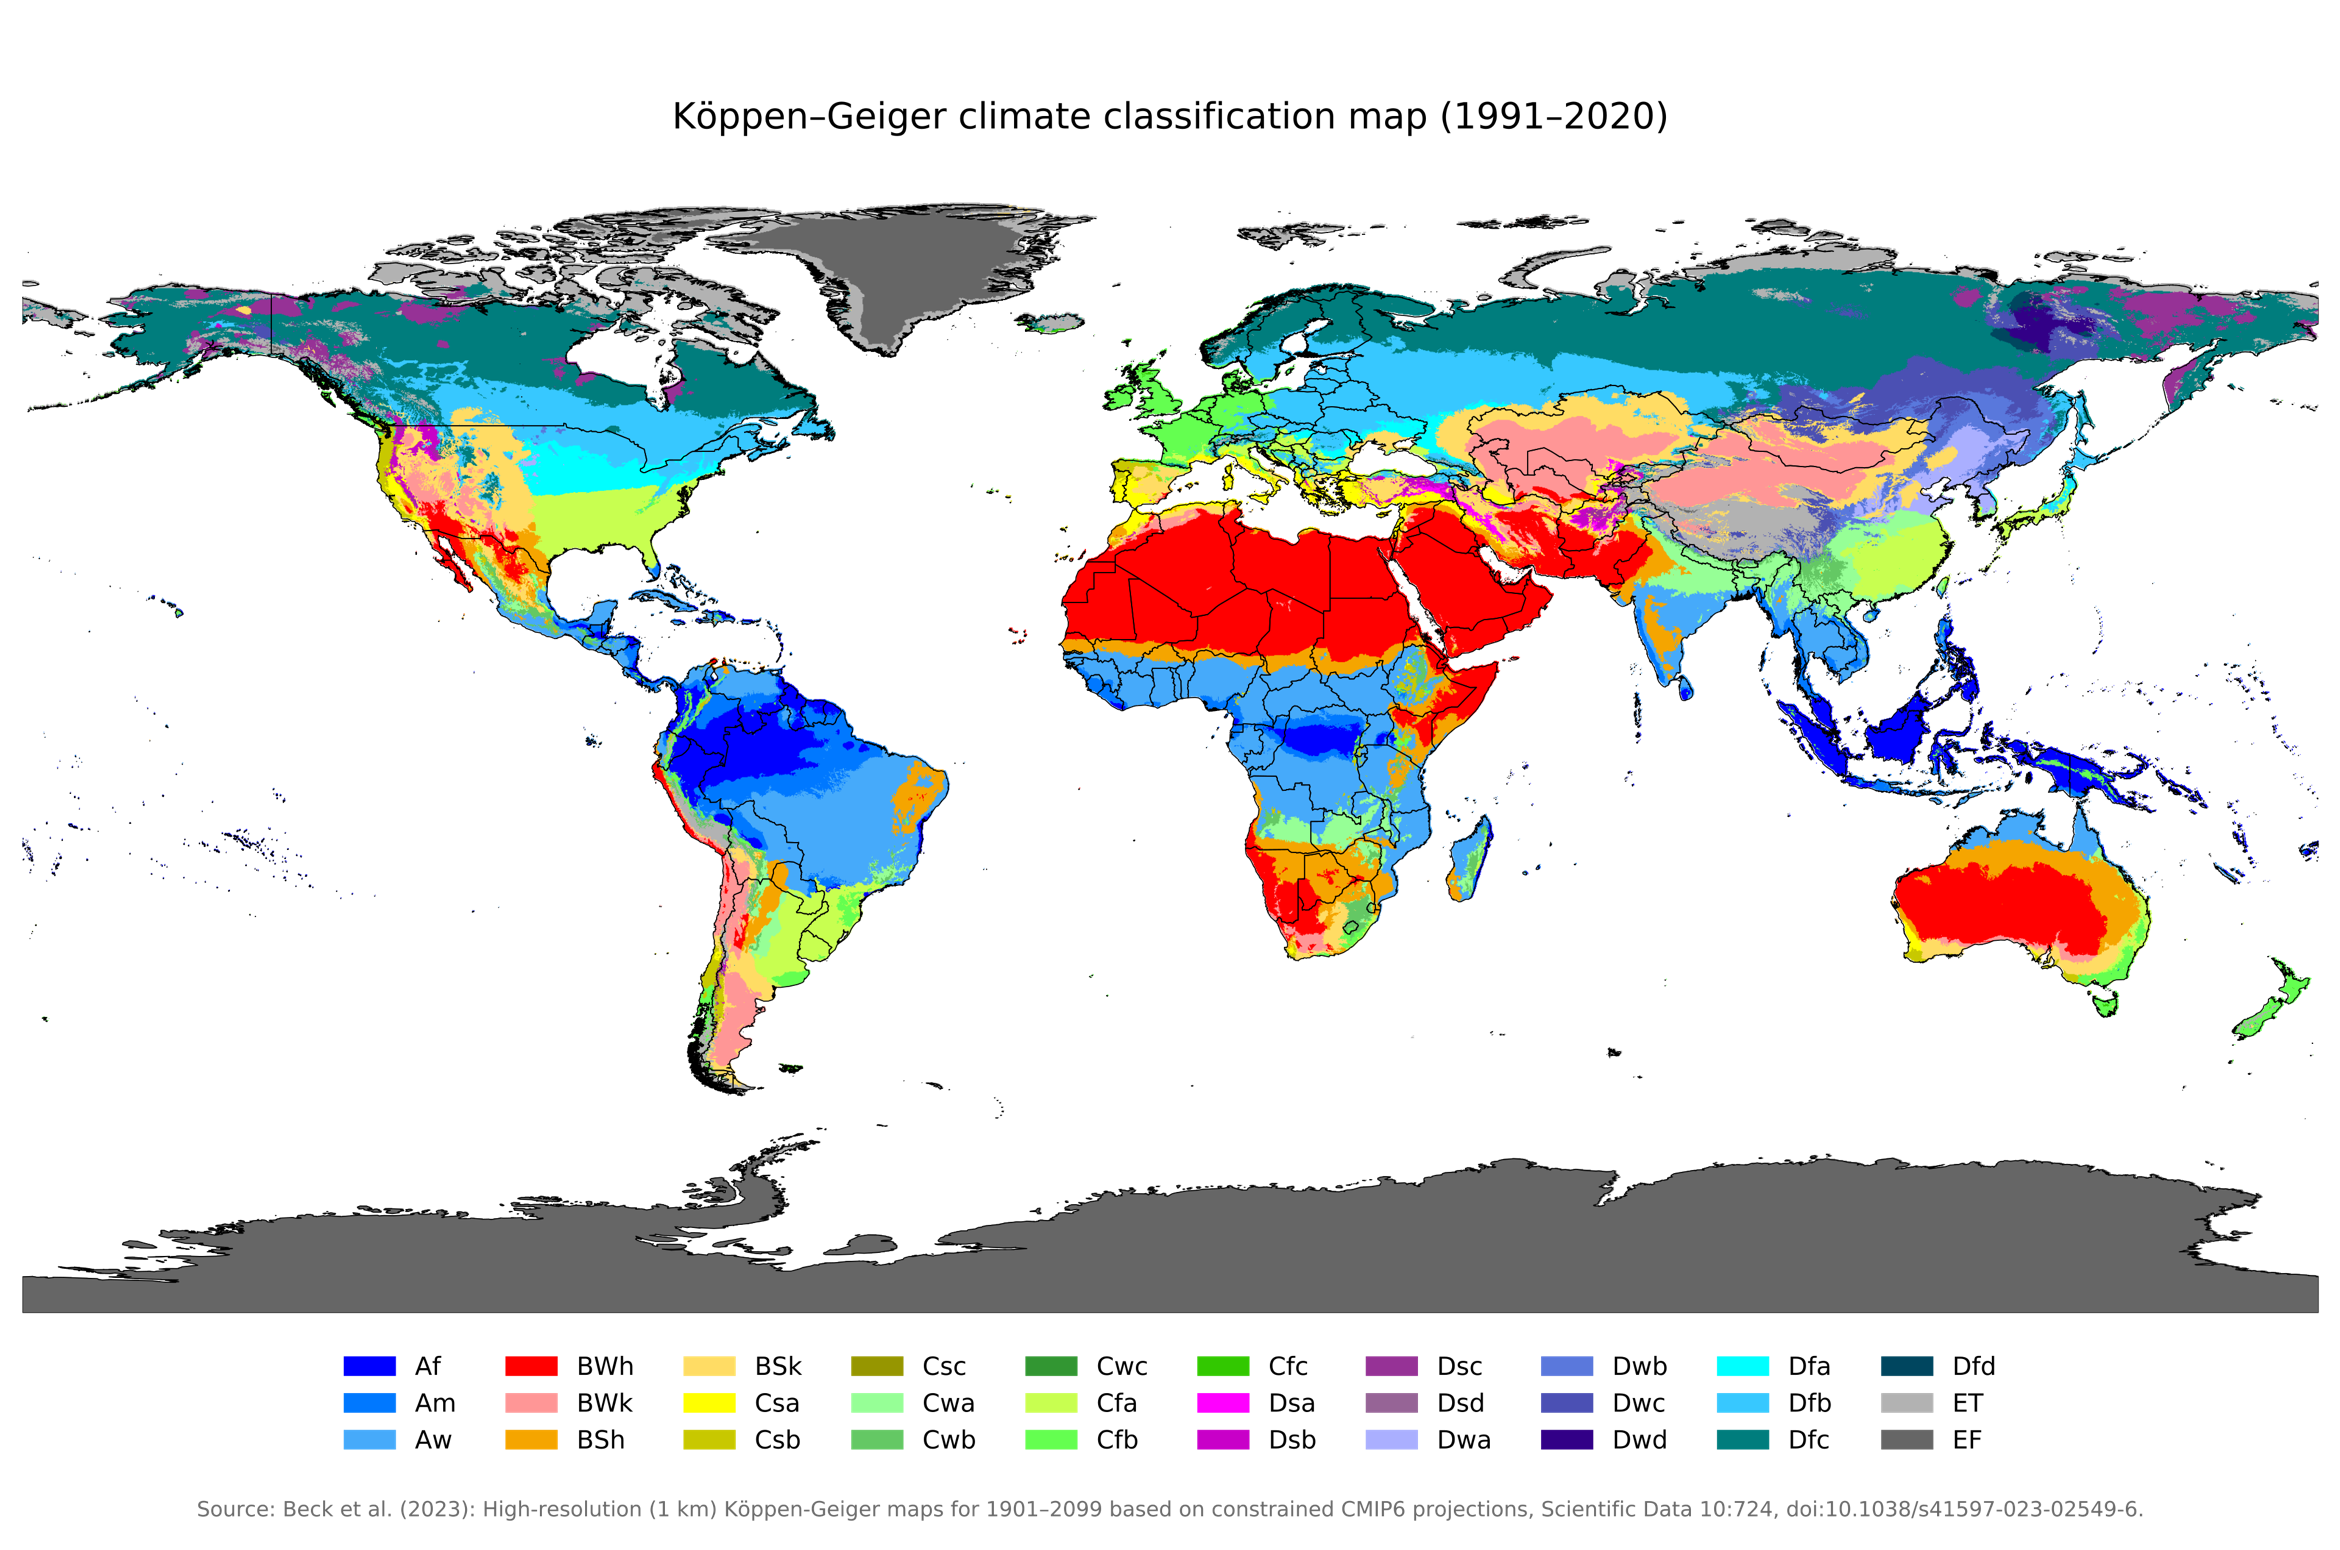
FIGURE 9.6 Global distribution of Köppen-Geiger climate classification system types based on 1991-2020 average climate data. Image Source: Wikimedia Commons. This image is licensed under the Creative Commons Attribution 4.0 International license.

FIGURE 9.7 Tropical broadleaf forest located along a stream in Cameroon, Africa. This type of forest biome type is common to Af climates. Image Source: Wikimedia Commons, photo by Earwig, the copyright holder of this photo has permitted its use.

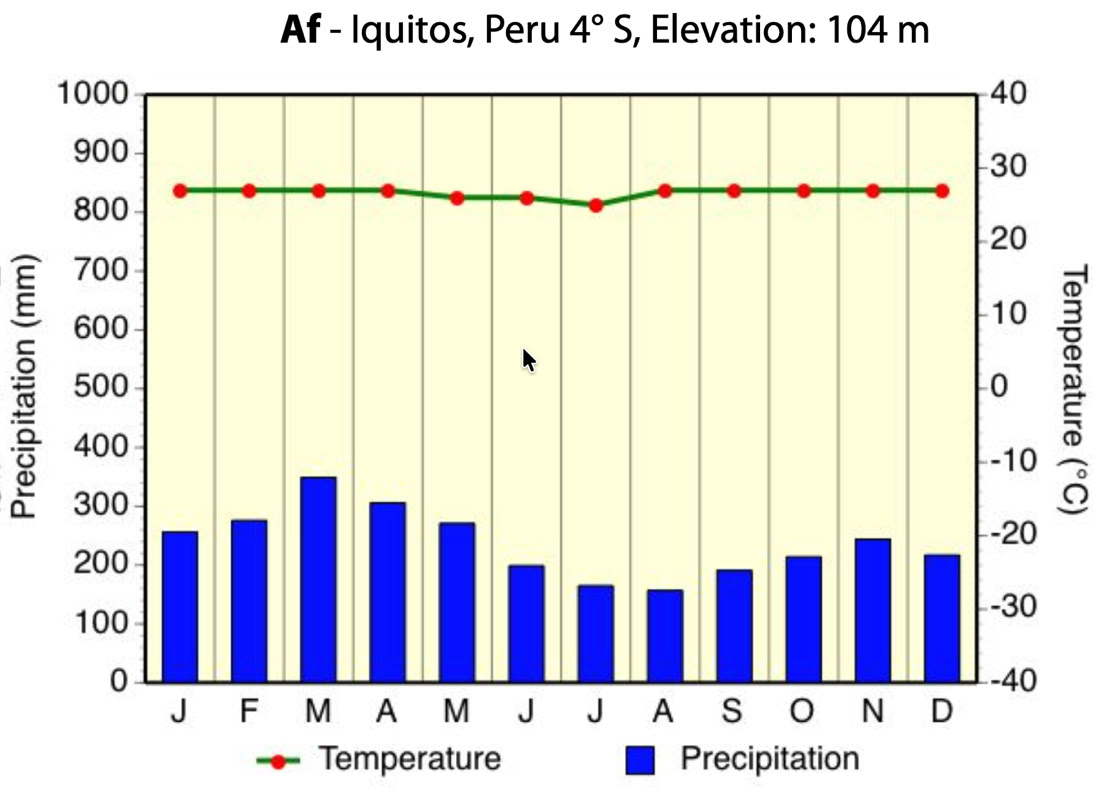
FIGURE 9.8 Average monthly temperature and precipitation data for Paramaribo, Suriname and Iquitos, Peru. Image Copyright: Michael Pidwirny, Data Source: www.worldclimate.com.

FIGURE 9.9 Acacia savanna south of Fada N'Gourma, Burkina Faso. Savanna ecosystems are common to Aw climates. Image Source: Wikimedia Commons, photo by Marco Schmidt. This image is licensed under the Creative Commons Attribution-Share Alike 2.5 Generic license.


FIGURE 9.10 Average monthly temperature and precipitation data for Calcutta, India and Cuiaba, Brazil. Image Copyright: Michael Pidwirny, Data Source: www.worldclimate.com.


FIGURE 9.11 Average monthly temperature and precipitation data for Chittagong, Bangladesh and Cochin, India. Image Copyright: Michael Pidwirny, Data Source: www.worldclimate.com.

FIGURE 9.12 Xerophytic vegetation common to the Baja California Desert, Cataviña region, Mexico. Image Source: Wikimedia Commons, photo by Tomas Castelazo. This image is licensed under the Creative Commons Attribution-Share Alike 2.5 Generic license.


FIGURE 9.13 Average monthly temperature and precipitation data for Luxor, Egypt and Alice Springs, Australia. Image Copyright: Michael Pidwirny, Data Source: www.worldclimate.com.


FIGURE 9.14 Average monthly temperature and precipitation data for Monterrey, Mexico and Bulawayo, Zimbabwe. Image Copyright: Michael Pidwirny, Data Source: www.worldclimate.com.

FIGURE 9.15 Average monthly temperature and precipitation data for Lovelock, Nevada, USA. Image Copyright: Michael Pidwirny, Data Source: www.worldclimate.com.

FIGURE 9.16 Average monthly temperature and precipitation data for Denver, Colorado, USA. Image Copyright: Michael Pidwirny, Data Source: www.worldclimate.com.


FIGURE 9.17 Average monthly temperature and precipitation data for Atlanta, Georgia, USA and Buenos Aires, Argentina. Image Copyright: Michael Pidwirny, Data Source: www.worldclimate.com.

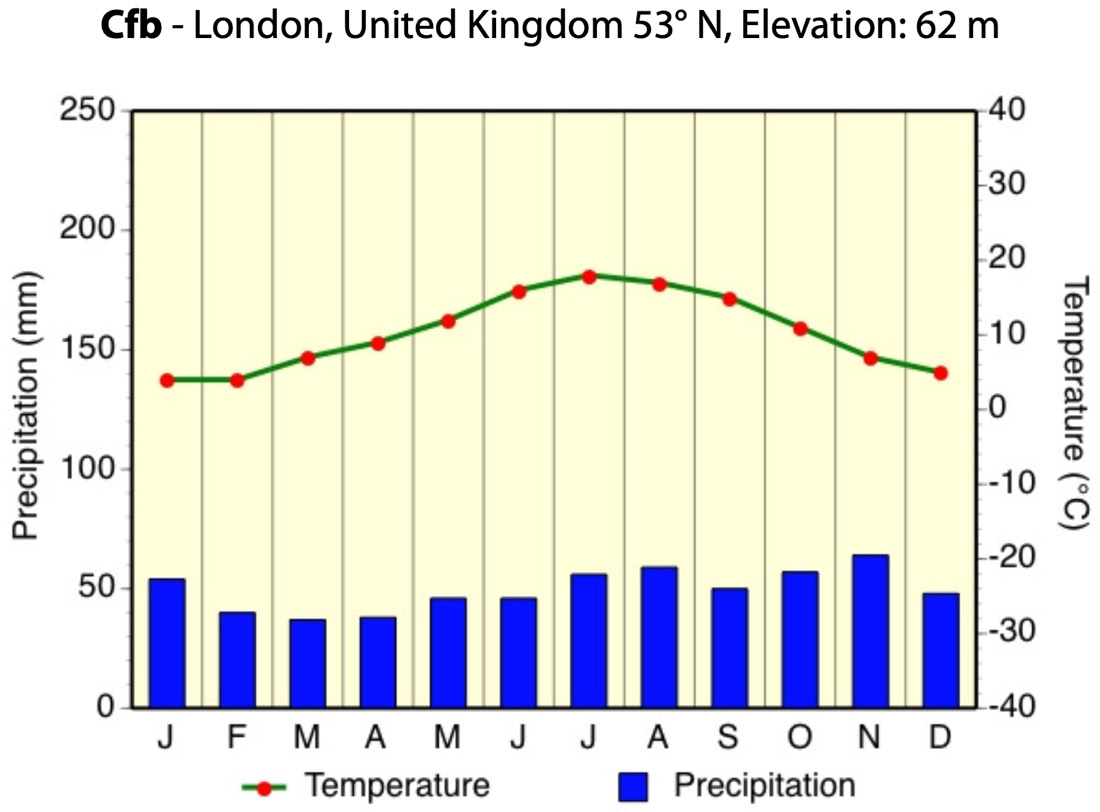
FIGURE 9.18 Average monthly temperature and precipitation data for Vancouver, Canada and London, United Kingdom. Image Copyright: Michael Pidwirny, Data Source: www.worldclimate.com.


FIGURE 9.19 Average monthly temperature and precipitation data for Omaha, Nebraska, USA and Guangzhou, China. Image Copyright: Michael Pidwirny, Data Source: www.worldclimate.com.


FIGURE 9.20 Average monthly temperature and precipitation data for Santiago, Chile and Rome, Italy. Image Copyright: Michael Pidwirny, Data Source: www.worldclimate.com.

FIGURE 9.21 Average monthly temperature and precipitation data for Winnipeg, Canada. Image Copyright: Michael Pidwirny, Data Source: www.worldclimate.com.

FIGURE 9.22 Average monthly temperature and precipitation data for Calgary, Canada. Image Copyright: Michael Pidwirny, Data Source: www.worldclimate.com.


FIGURE 9.23 Average monthly temperature and precipitation data for Isachsen, Canada and Ushuaia, Argentina. Image Copyright: Michael Pidwirny, Data Source: www.worldclimate.com.


FIGURE 9.24 Average monthly temperature and precipitation data for Eismitte, Greenland and Vostok, Antarctica. Image Copyright: Michael Pidwirny, Data Source: www.worldclimate.com.