Latitude
The most important factor controlling surface air temperature is incoming radiation. On the Earth’s surface, the amount of radiation input is largely influenced by the intensity and duration of insolation. As a result of these two factors, the quantity of incoming solar radiation available at the surface varies annually with latitude (see Figure 4.27 in Chapter 4, section Daily and Annual Cycles of Insolation). From the equator to the North and South Poles, seasonal variations in day length and angle of incidence become greater with increasing latitude. Because of these variations, seasonal deviations in surface air temperature also become more extreme as we approach the poles (Figure 6.9). The highest temperatures roughly correspond to the summer season, when day lengths are longest, and the Sun's angle is at its maximum. The lowest temperatures occur when day length is shortest, and the Sun's angle is at its minimum (winter). Locations near the equator have only small variations in solar input annually because seasonal changes in day length and angle of incidence are slight. Consequently, variations in surface air temperature over one calendar year are also minor (Figure 6.9).
Altitude
Surface air temperatures tend to cool gradually with increasing elevation. This phenomenon is well known to anyone living in a mountainous region. Temperatures in the valley bottoms are generally warmer than temperatures on mountainsides and peaks. When observing mountains from a distance, we can roughly estimate their elevation by finding the snow line, which indicates a surface temperature of 0°C (32°F). Above this boundary, temperatures are cold enough to keep snow and ice frozen. Below the snow line, average temperatures are above freezing.
Figure 6.10 describes the monthly mean temperatures for four locations in equatorial Colombia with similar latitudes but different elevations. Girardot has the lowest elevation (286 m, 938 ft) and a mean annual temperature of about 28°C (82°F). Just above Girardot are Chinchina (1310 m, 4298 ft) and Tibacuy (1525 m, 5003 ft), with mean annual temperatures of 21°C (66°F) and 19°C (70°F), respectively. Bogota has the highest elevation (2556 m, 8386 ft) and an average annual temperature of about 14°C (57°F). We can calculate the rate of temperature drop between these places to be about 6.1°C per 1000 m (3.3°F per 1000 ft). This drop in temperature is due to the atmosphere becoming less dense with increasing altitude.
The density of air influences both the heating and cooling of the atmosphere near the Earth’s surface. At high elevations, less incoming shortwave radiation is absorbed and reflected by particles in the atmosphere lying overhead. This results in more incoming radiation available for conversion into heat energy. The most obvious outcome of increased heat energy is a relatively rapid rise in daytime air temperature in high-elevation locations. A thin atmosphere also causes less of the outgoing longwave radiation to be reradiated back to the Earth’s surface, where it can be converted into heat energy again. This greenhouse effect depends on water availability and other greenhouse gases. When the air becomes thinner, the quantity of these atmospheric substances declines. The net result of a weaker greenhouse effect is rapid and intense nighttime cooling. The magnitude of this nighttime cooling is usually greater than the additional heat produced by more intense solar radiation. Consequently, daily mean, monthly mean, and annual mean temperatures generally decrease as altitude increases.
Cloud Cover
The presence of cloud cover has a definite effect on air temperature. During the daytime, cloud cover tends to block the transmission of sunlight to the Earth’s surface (Figure 6.11). Less solar radiation leads to reduced heat generation and lower surface air temperatures. This process explains why daytime temperatures are cooler along the equator and hotter in the subtropical deserts. At the equator,cumulus and cumulonimbus (thunderstorm) clouds develop almost daily, reducing the amount of incoming solar radiation absorbed at the Earth’s surface. In the subtropical deserts, skies are usually clear, maximizing the flow of solar radiation through the atmosphere to the surface. Thus, high surface heat generation makes desert temperatures very high during the day.
At night, the presence of clouds is associated with less dramatic nighttime cooling (Figure 6.12). Nighttime cooling results from heat energy in the lower atmosphere being converted into outgoing longwave radiation. In a clear atmosphere, most of this emission leaves the Earth, and only a small amount of this outgoing energy is reemitted as counter-radiation to partially offset radiative cooling at the Earth’s surface and lower atmosphere. The presence of clouds greatly enhances the greenhouse effect. When cloud cover is extensive and thick, most of the outgoing longwave is redirected back to the surface, where it again creates heat energy. Therefore, cloudy nights tend to be warmer than cloudless nights.
Maritime and Continental Effects
The two dominant surface types found on the Earth are land and water. These surface types influence the heating and cooling of the air directly above them differently. Simply stated, the heating and cooling of air over land is more intense and rapid, creating more extreme temporal variations in surface air temperature. The causes of this phenomenon are related to the following factors:
- Because of its solid form and low thermal conductivity, only a small portion of the heat energy created by the absorption of solar radiation at the land's surface flows into this substance.
- Most of the heat created by absorption flows almost immediately into the atmosphere by conduction and convection. This transfer of energy is high when the insolation input is great. Likewise, when insolation is low, the amount of heat entering the atmosphere is low. This fact explains why extreme diurnal (daily) and annual air temperature variations occur over land.
Water stores a lot of heat energy because of its fluid nature and high specific heat. Fluid mixing redistributes the heat generated from solar radiation absorption throughout the vertical expanse of the water body. Thus, deep bodies of water, such as our planet's oceans, contain heat energy from thousands of years of absorbing insolation. Some of this heat is available for conductive and convective transfer into the atmosphere. The amount of heat transferred from the ocean's surface to the lower atmosphere is strongly controlled by the heat stored in the oceans. Annual variations in solar radiation availability have a minimal effect on the amount of this heat flow. Consequently, the heat energy flowing into the atmosphere is relatively high even when insolation input is low.
Figure 6.13 illustrates the maritime effect of oceans on surface air temperature. The graphs in this figure describe the annual variations in monthly mean, maximum, and minimum air temperature for four terrestrial locations with similar latitudes but differing proximity to the Pacific and Atlantic Oceans. Vancouver and St. John's are located along North America's west and east coasts, respectively. Minot and Winnipeg are found at the center of North America, and their climates are strongly influenced by the continental effect (also called continentality). Comparing the monthly temperatures of these places reveals that annual variations are almost twice as great for the continental locations. Minot and Winnipeg also show greater differences between monthly maximum and minimum temperatures in most months, indicating greater diurnal variation. Among maritime climates, Vancouver is slightly milder than St. John's and experiences less annual temperature variation. The moderating influence of the oceans is greater in Vancouver because mid-latitude weather generally travels from west to east.
The maritime and continental effects also influence global-scale variations in surface air temperature. The latitudinal distribution of land and water on Earth's surface is uneven. From 30° North to 70° North, more land than water covers the Earth's surface, while from 30° South to 70° South ocean surface dominates. The climatic effects of this difference are shown in Table 6.2. For the regions of interest, the data in this table indicate that seasonal temperature fluctuations in the Southern Hemisphere are considerably less than in the Northern Hemisphere.
Ocean Currents
Ocean waters on our planet are constantly in motion. These seawater motions occur horizontally and vertically. Horizontal movements of ocean waters produce surface and subsurface flows known as ocean currents. Currents that occur at the ocean's surface are driven by the winds associated with the large-scale global circulation of the atmosphere. Frictional drag from wind blowing over the ocean surface is the primary factor determining the course of these currents. The presence of land masses can also influence the direction of ocean currents. These barriers redirect the flow of east or west-flowing currents in a north or south direction. We will examine the characteristics of our planet's surface ocean currents in greater depth in Chapter 19.
Surface ocean currents can influence the climate of locations because the ocean water they transport can have a contrasting temperature. Currents that flow from the tropics to higher latitudes generally have relatively warm flows. Cold ocean water flows occur when currents move from the high latitudes to the tropics. The moderating effect of warm ocean currents on land temperatures is well known. The Gulf Stream warms temperatures along the eastern seaboard of the United States from Florida to North Carolina (Figure 6.14). Also, an extension of this flow, known as the North Atlantic Drift, travels across the Atlantic Ocean, warming air temperatures in Britain and Western Europe. This warming is most pronounced in the winter. For example, during this season, the average January mean temperature in Coimbra, Portugal, is 10.1°C (18.1°F) warmer than in Philadelphia, although the two locations are roughly at the same latitude (40°N).
Cold surface ocean currents originate in polar and temperate latitudes and generally flow toward the equator. Like warm surface currents, they are largely driven by atmospheric circulation. The effects of cold currents are most obvious in the summer. For example, the cold California Current off the west coast of the United States moderates air temperatures from Washington to California (Figure 6.14). The magnitude of this cooling can be seen by comparing summer temperature records from cities on the east and west coasts of the United States at similar latitudes. For example, the average July mean temperature in Santa Cruz, California, is 8.9°C (16.0°F) cooler than in Norfolk, Virginia. Yet, both locations are located at about 37°N latitude.
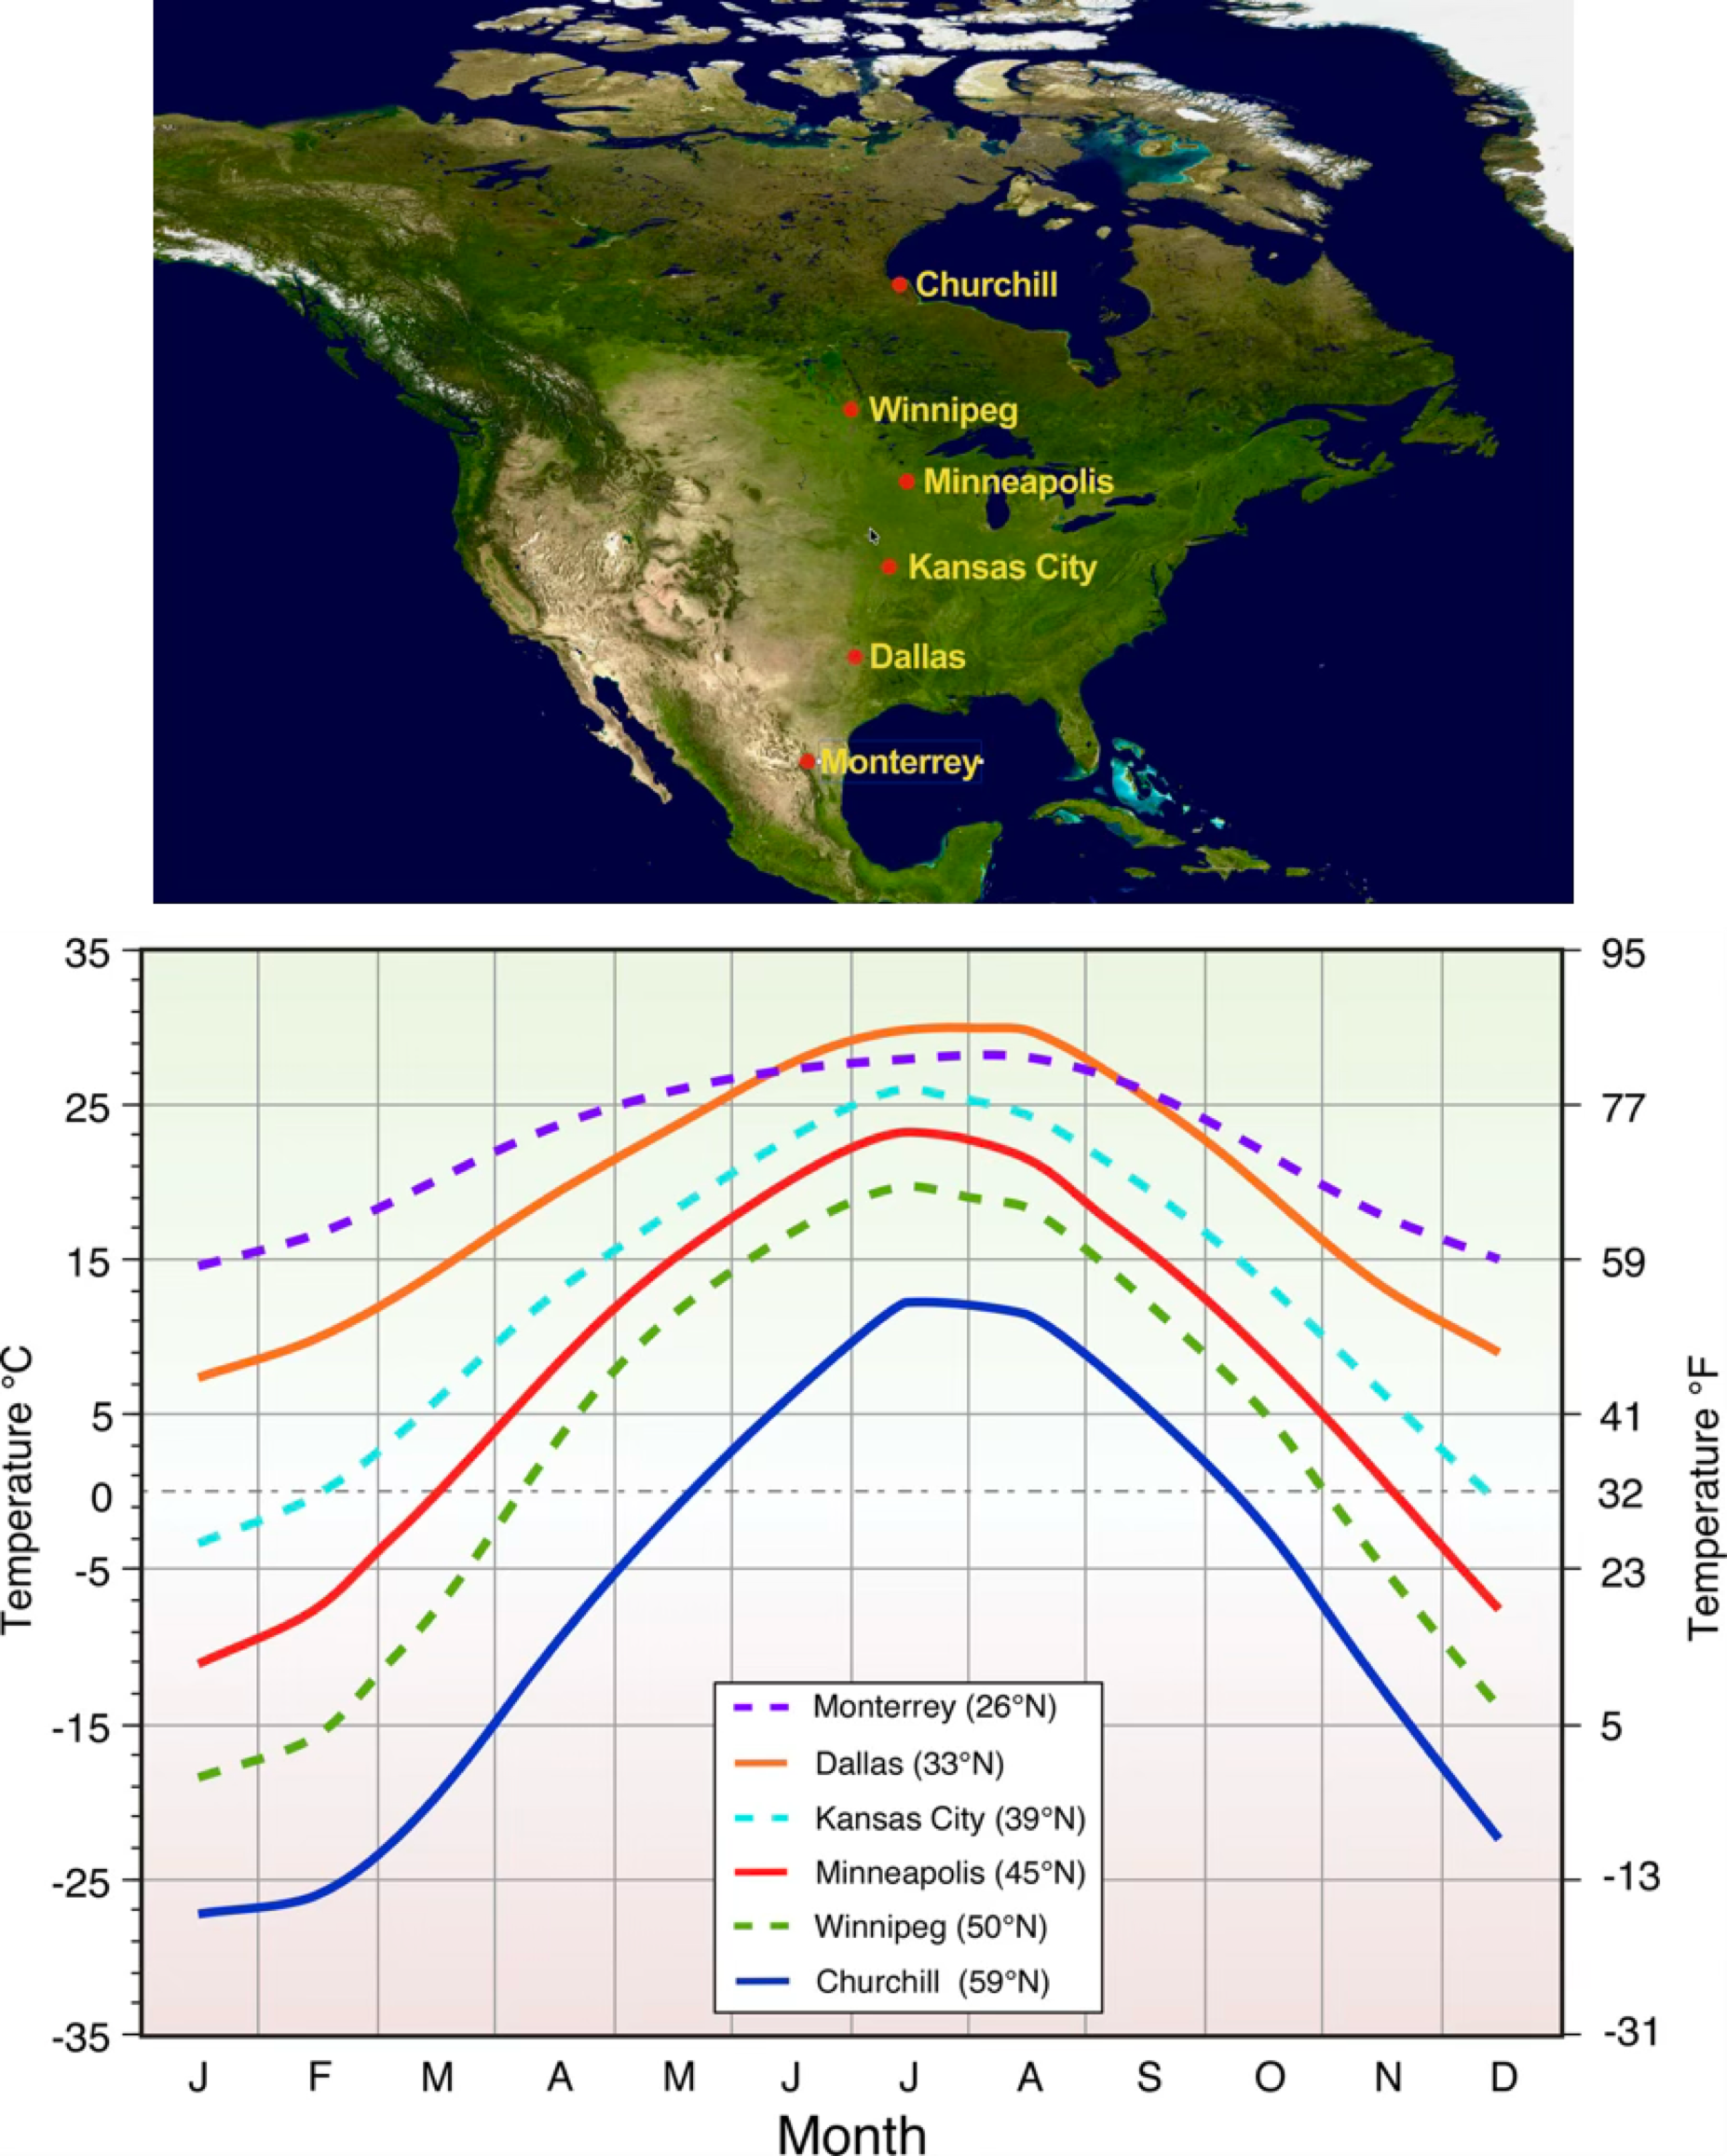
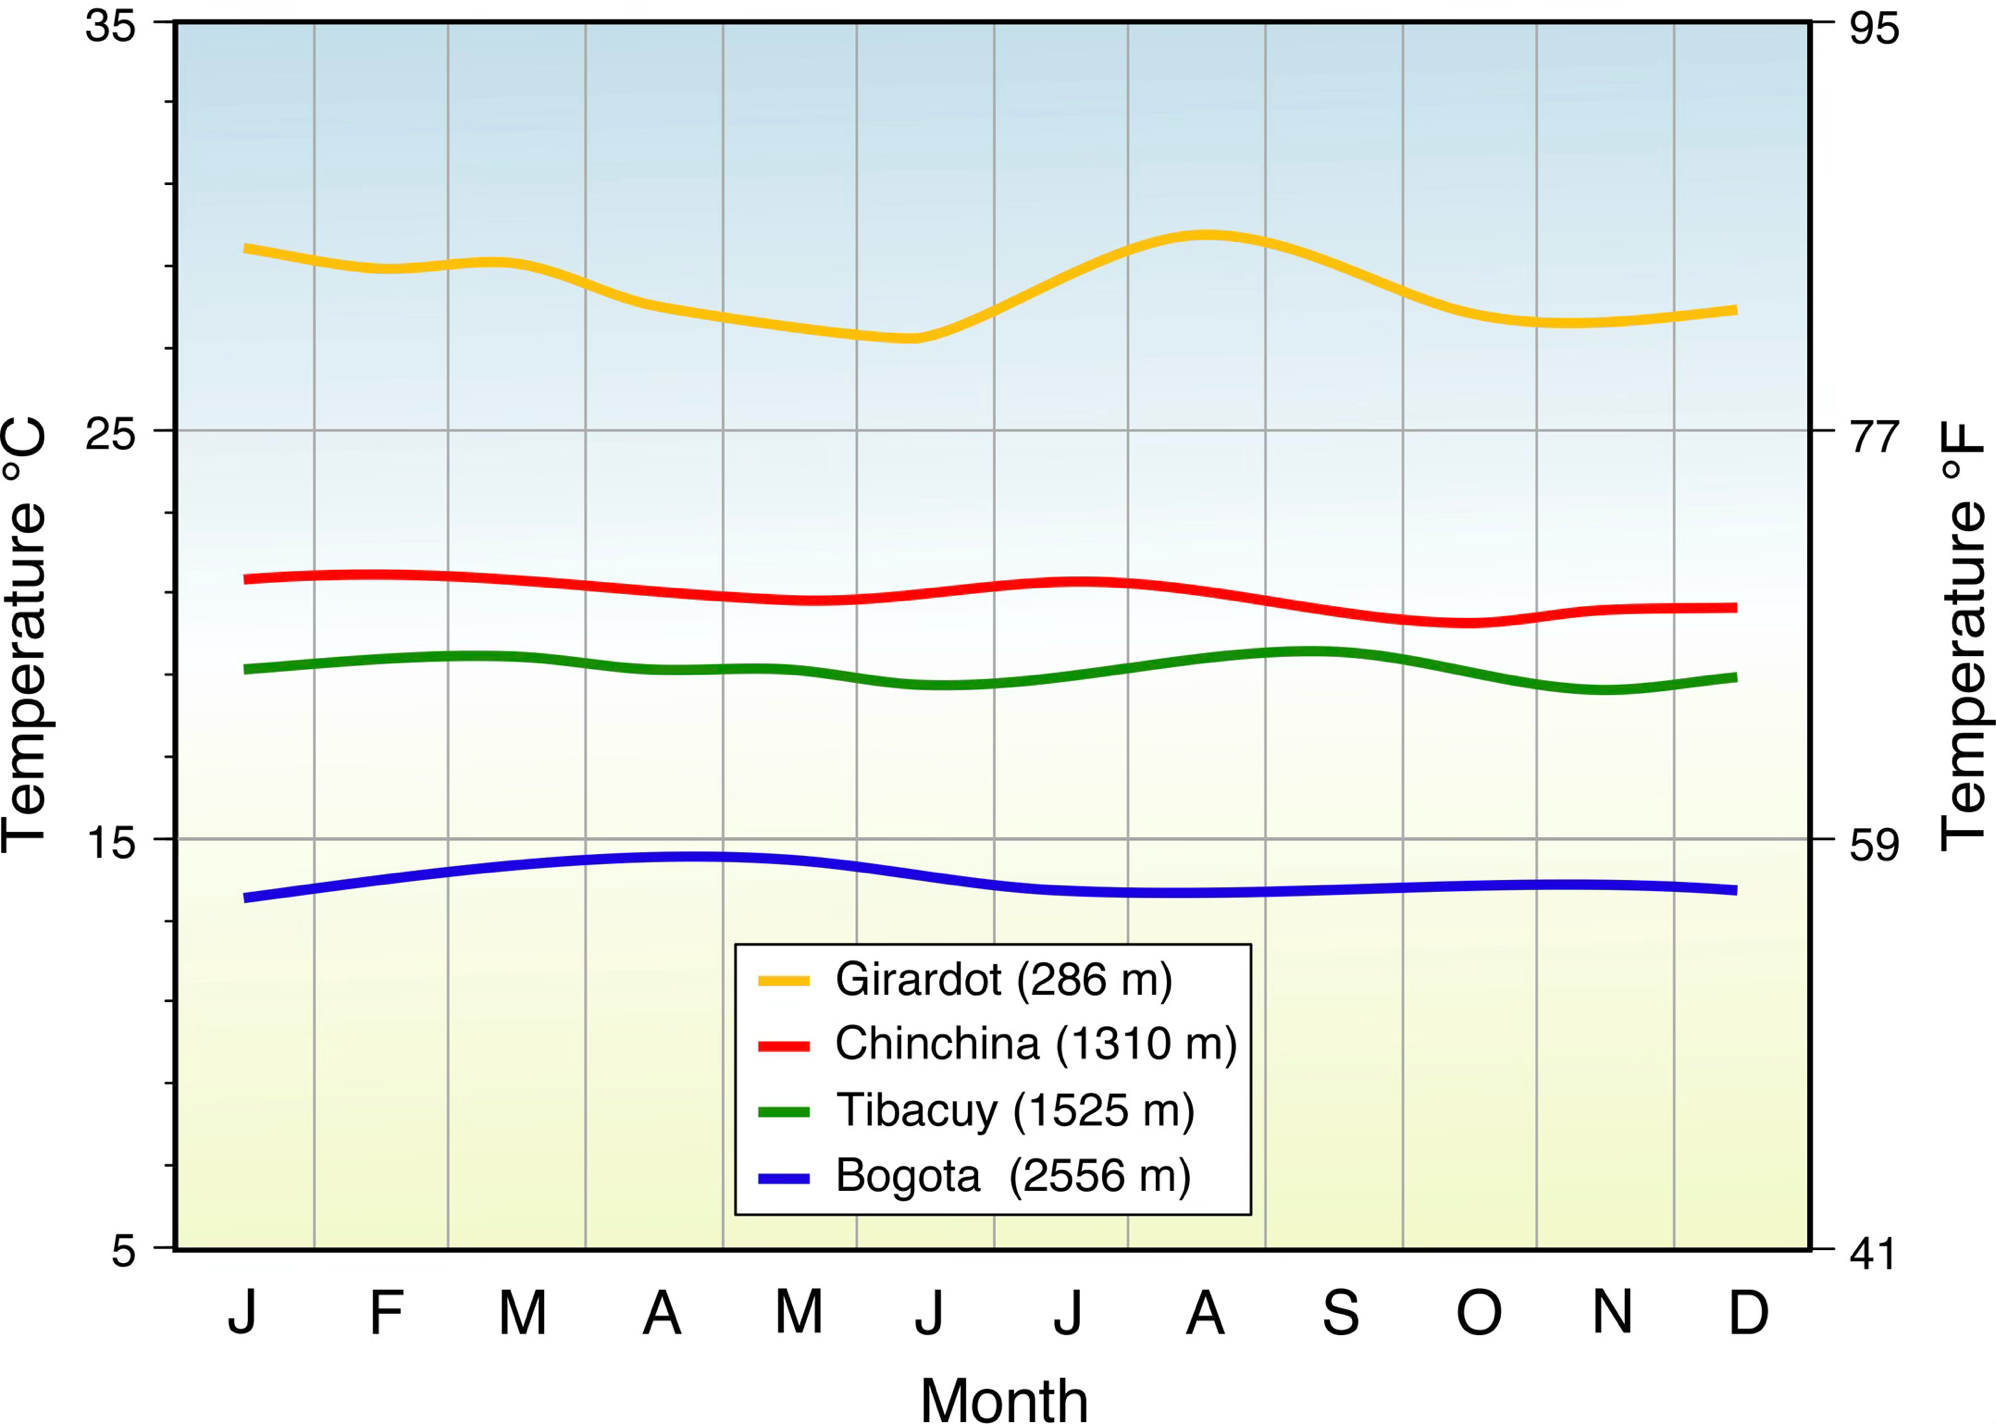
FIGURE 6.10 Elevation’s influence on mean monthly temperature. Shown is a comparison of mean monthly temperature patterns for four locations in Colombia with different elevations: Girardot (286 m, 938 ft), Chinchina (1310 m, 4298 ft), Tibacuy (1525 m, 5003 ft), and Bogota (2556 m, 8386 ft). These locations are found within 200 kilometers (125 miles) of each other at a latitude of about 5° North of the equator. Image Copyright: Michael Pidwirny.
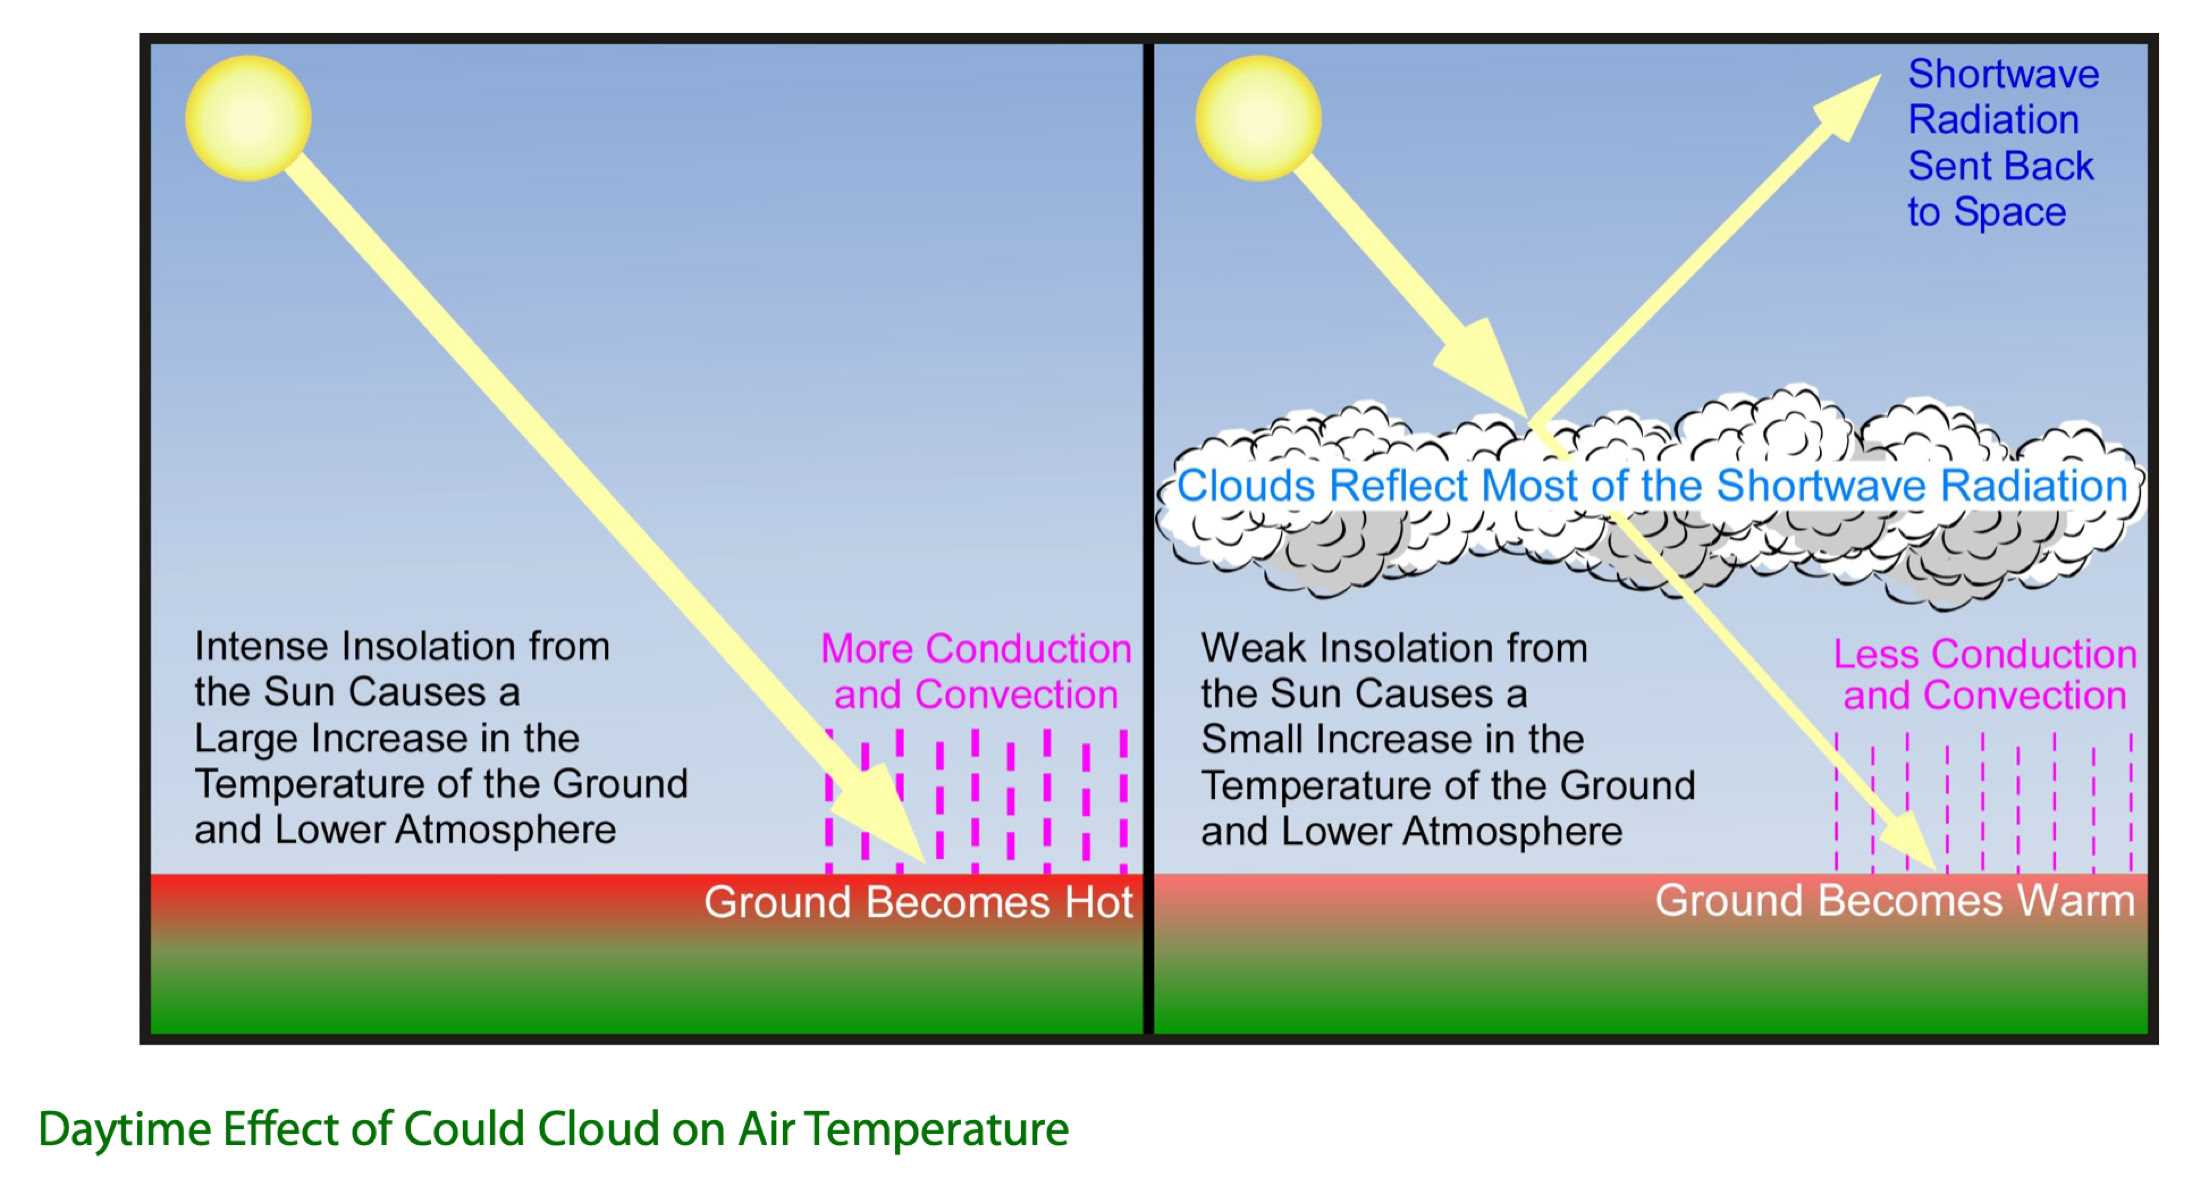
FIGURE 6.11 During the daytime (top image), cloud cover can reduce the transmission of sunlight to the Earth’s surface. Less insolation (insolation) absorbed results in less generated heat at the ground surface and minimizes the transfer of this heat by conduction and convection to the atmosphere. Image Copyright: Michael Pidwirny.

FIGURE 6.12 the presence of clouds at night reduces the loss of longwave radiation emitted back into space. The water in the clouds absorbs longwave radiation, which heats the clouds. These clouds then emit a sizable portion of this energy back to the ground surface as longwave radiation. This radiation is absorbed by the ground surface, generating heat. This heat is then transferred by conduction and convection to warm the lower atmosphere. Image Copyright: Michael Pidwirny.
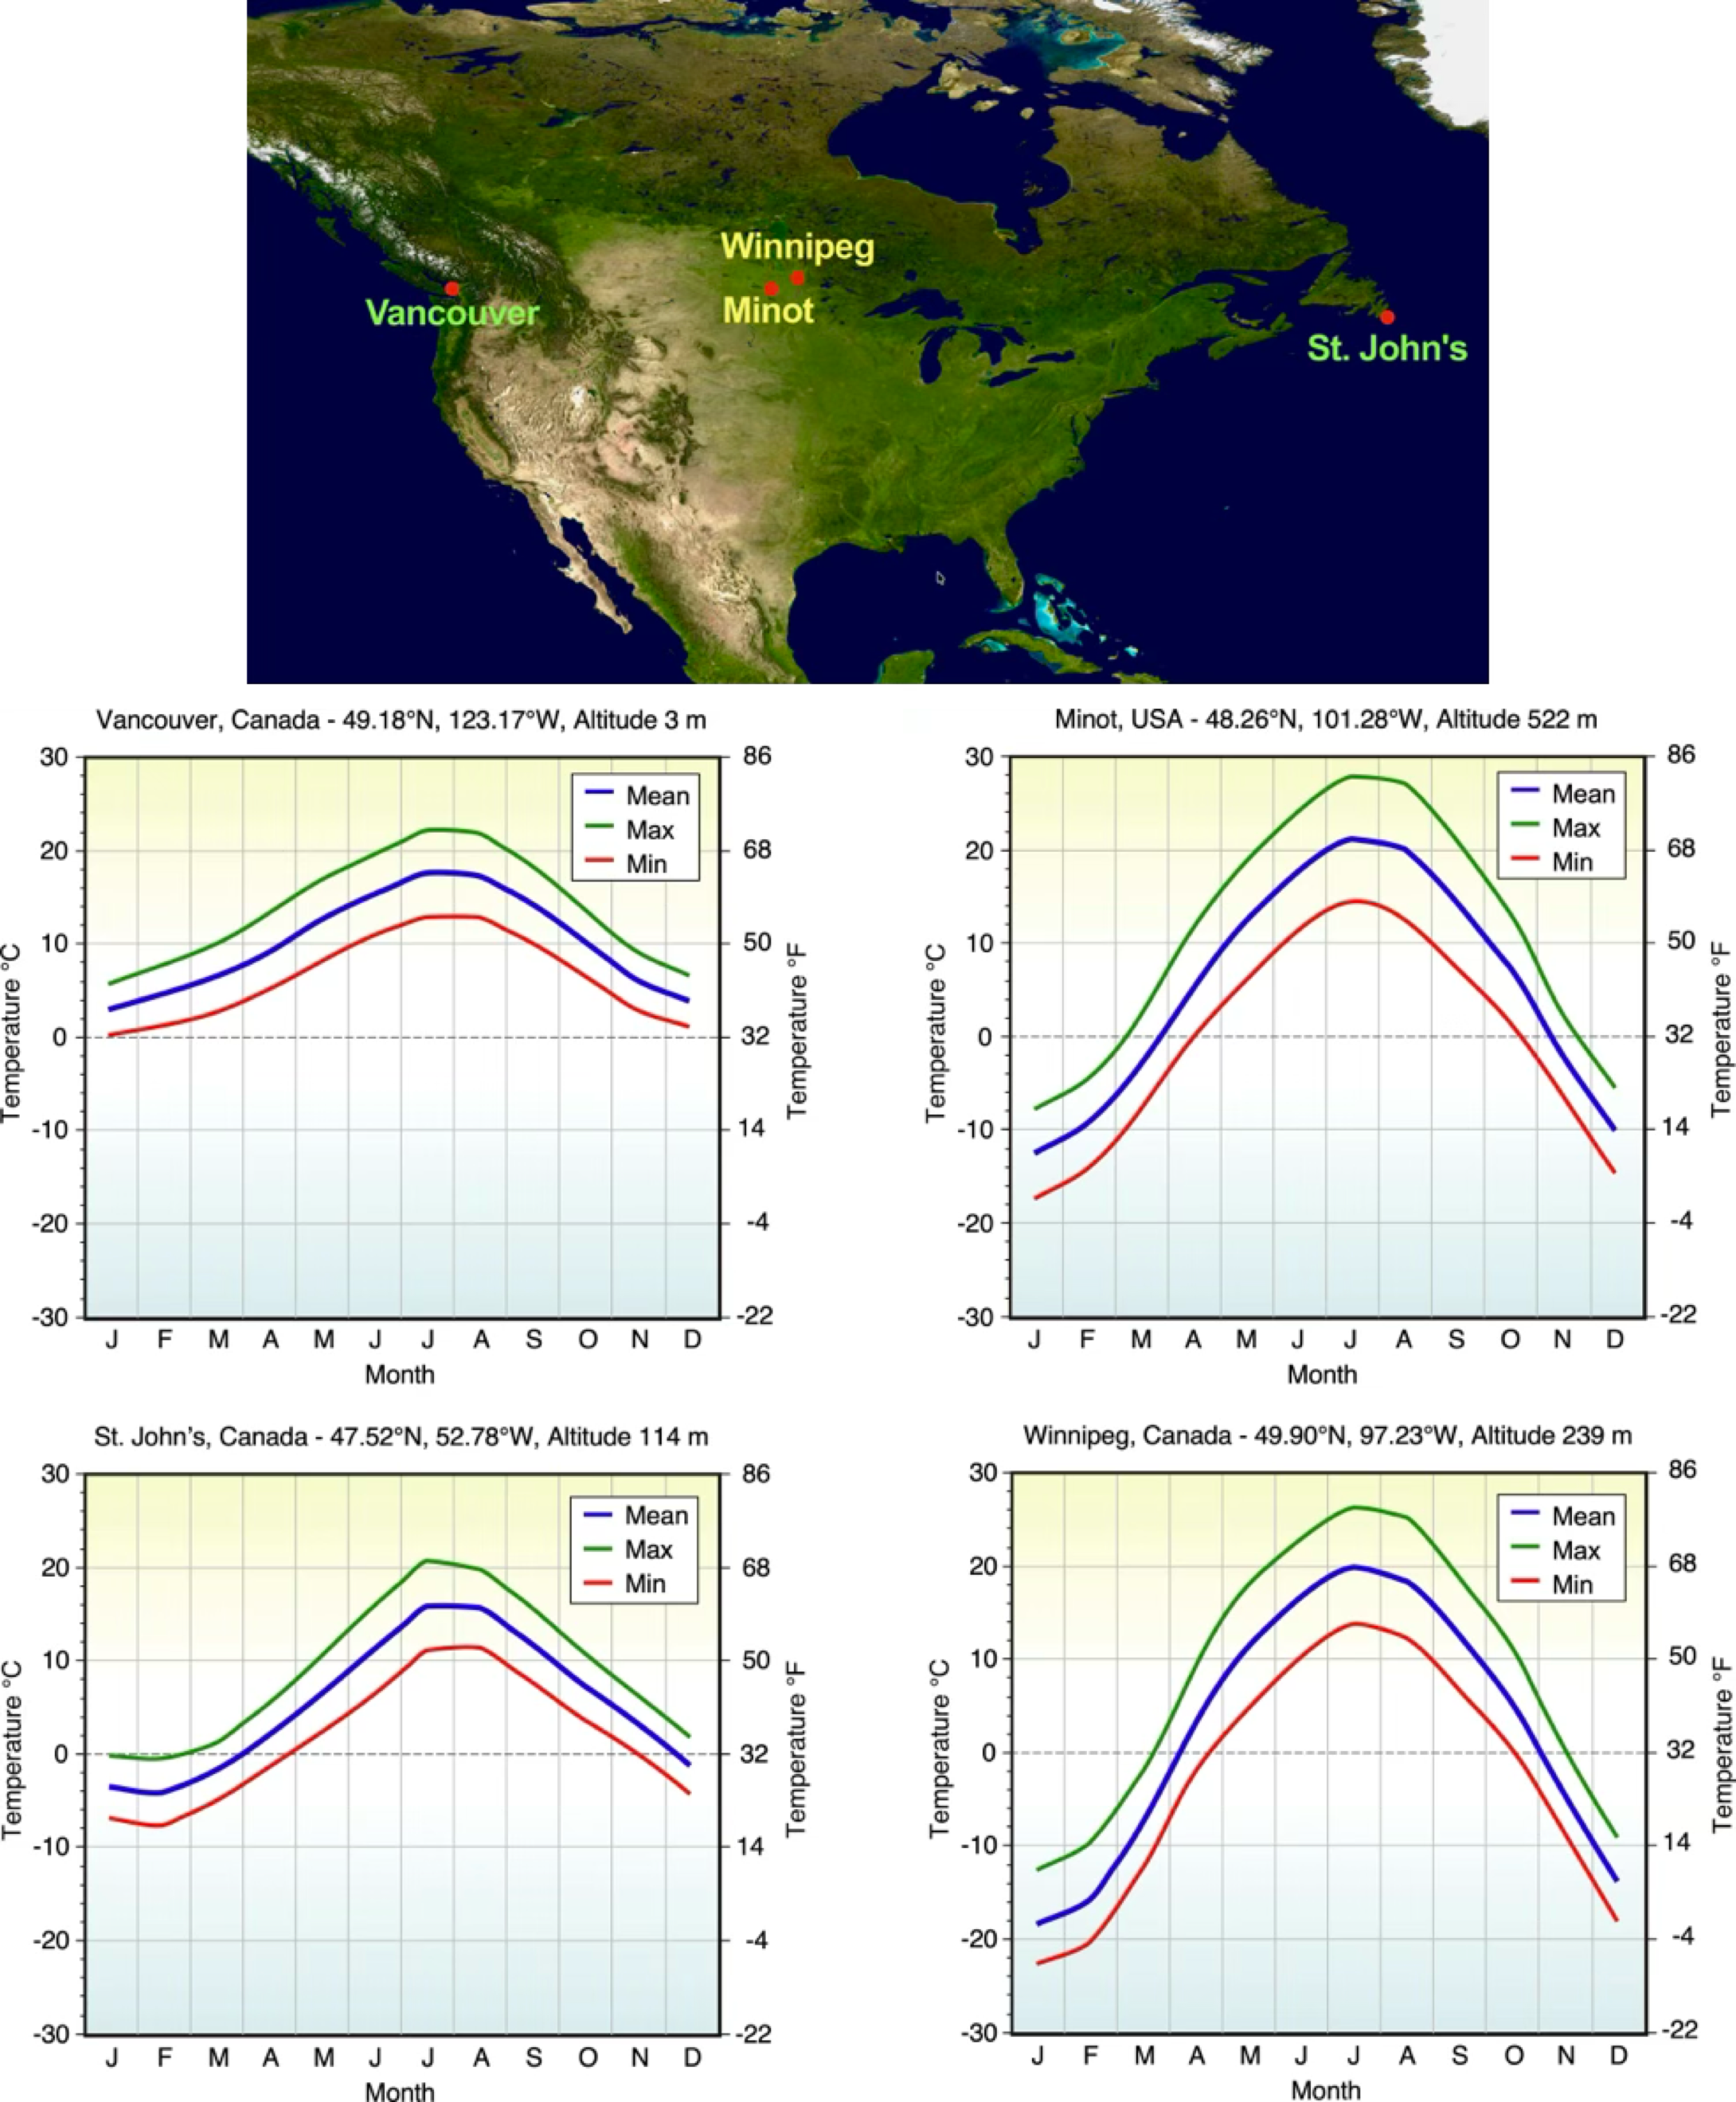
FIGURE 6.13 Maritime versus continental effects on monthly temperatures. Comparison of monthly mean, maximum, and minimum temperatures of two maritime (Vancouver and St. John’s) and two continental (Minot and Winnipeg) Northern Hemisphere locations with similar latitudes. Image Copyright: Michael Pidwirny.

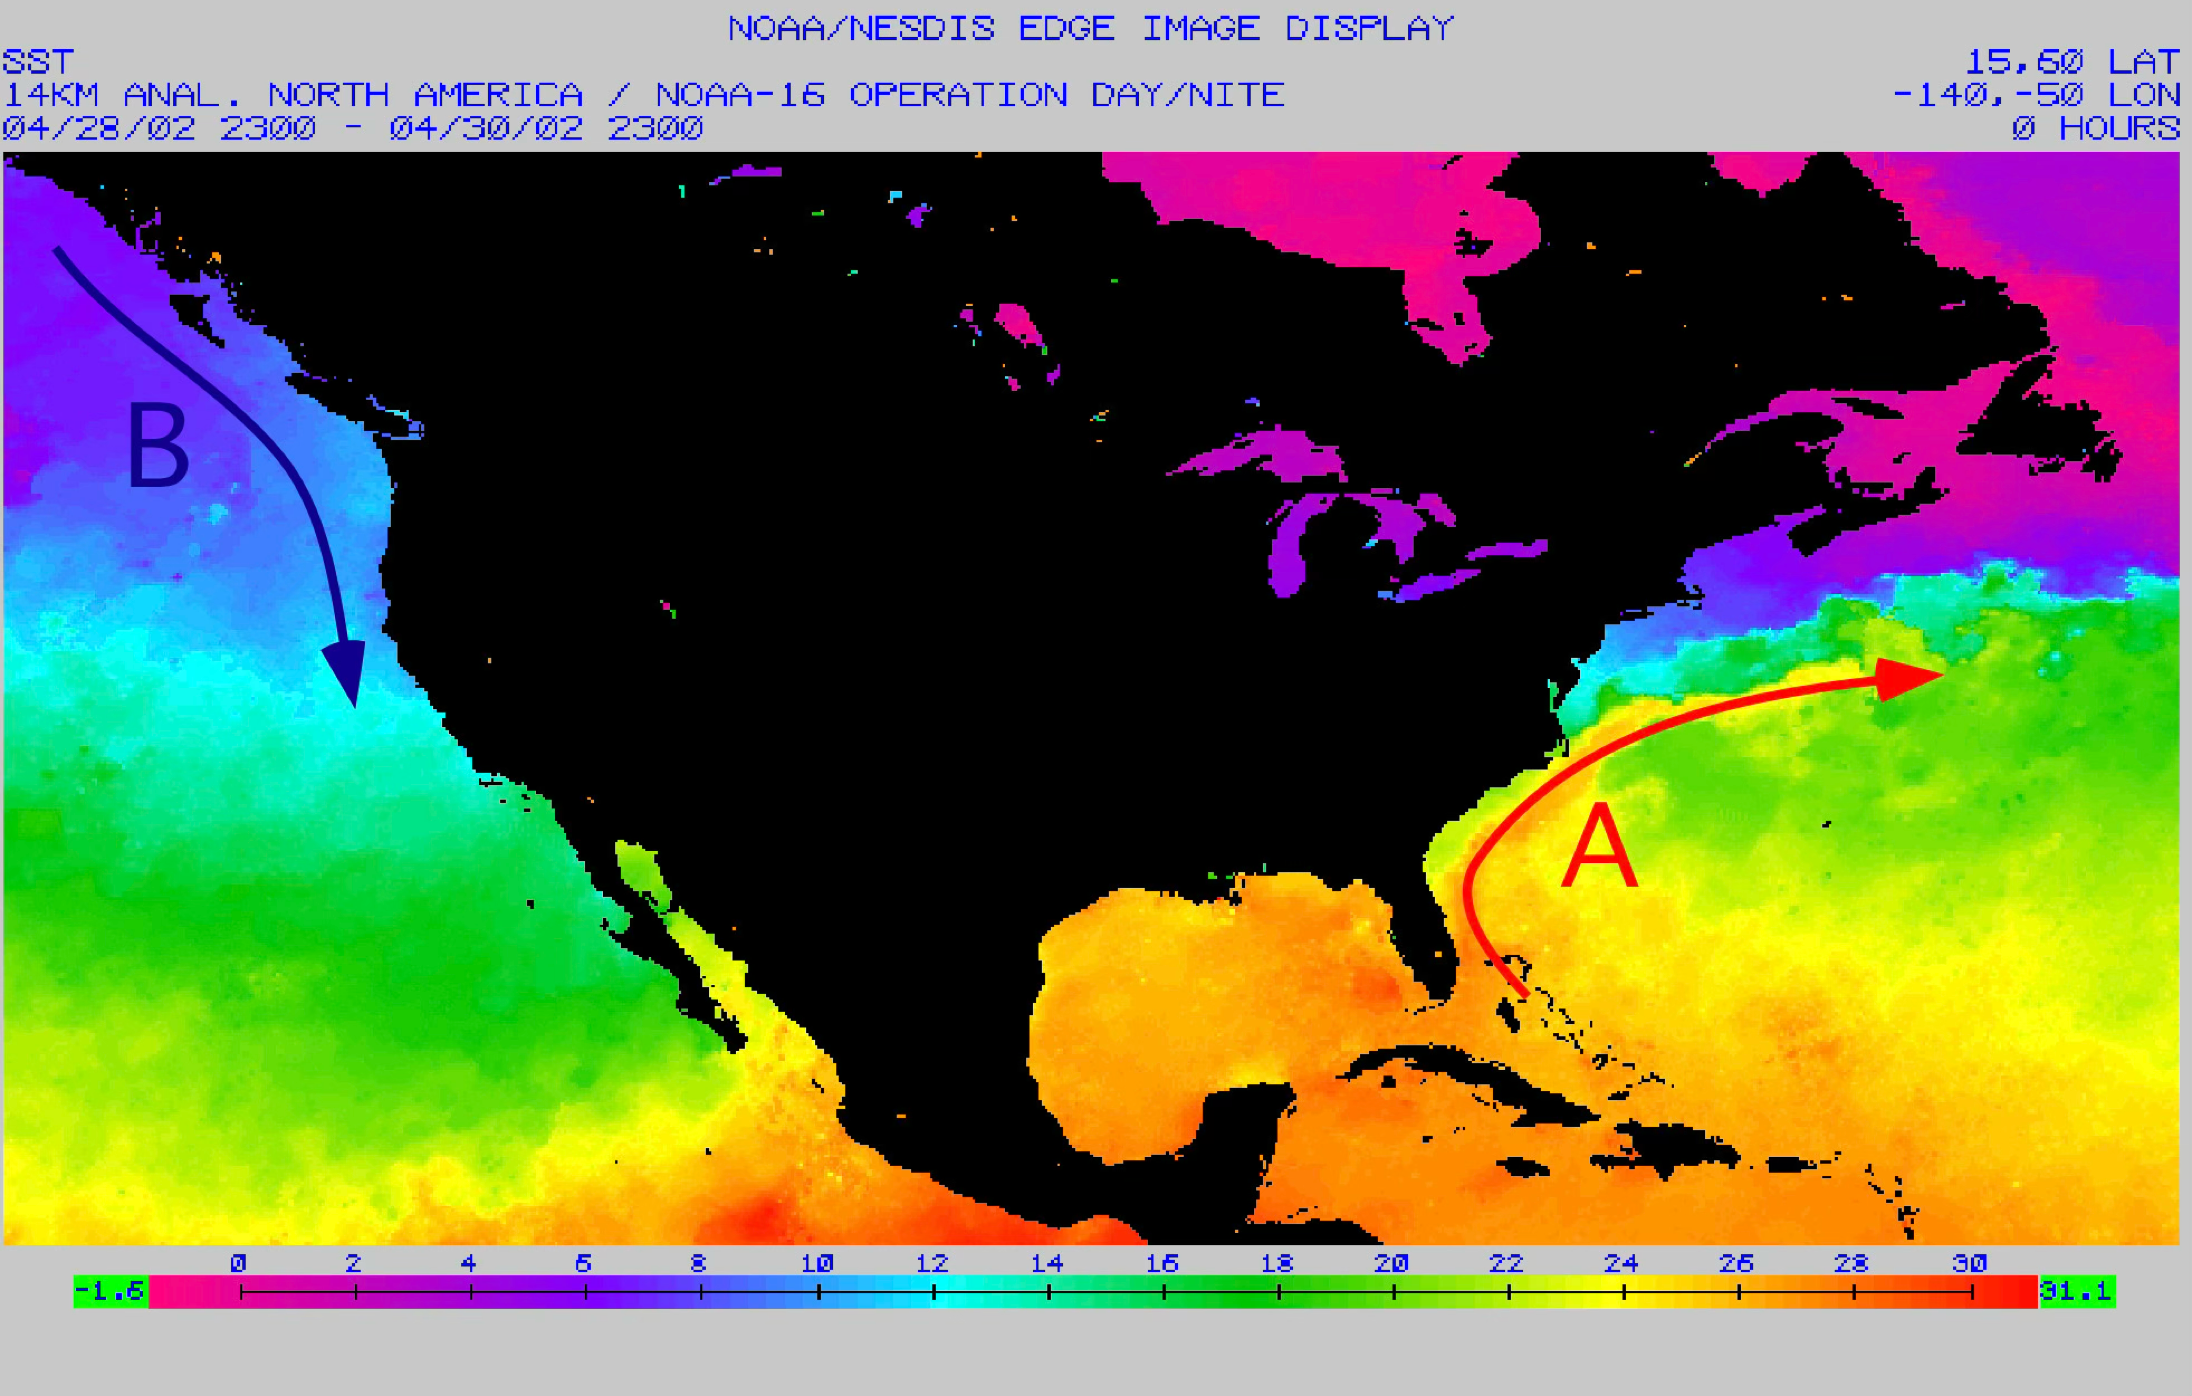
FIGURE 6 The Gulf Stream (A) moves a warm water current from the tip of Florida northward along the coastline of Georgia, South Carolina, and North Carolina. The Gulf Stream changes direction off the coast of Virginia and begins moving eastward. The California Current (B) starts off the coast of British Columbia, Canada, and moves cold water down the west coast of North America. The scale at the bottom matches the ocean surface temperature in degrees Celsius with the colors found on the satellite image. Modified Image Source: NOAA.
FIGURE 6.9 Latitude’s influence on mean monthly temperature. The mean monthly temperatures of five Northern Hemisphere locations with different latitudes are shown. The graph suggests that monthly temperatures generally increase as one moves toward the equator. Also, note that seasonal temperature variations between summer (June, July, and August) and winter (December, January, and February) become more extreme as latitude increases. Image Copyright: Michael Pidwirny.