
Almost all the energy that drives the various systems (climate systems, ecosystems, hydrologic systems, etc.) found on the Earth originates from the Sun. The Sun has been producing electromagnetic radiation for well over 4.6 billion years. Most of the Sun’s radiation is produced at the core of this body through nuclear fusion (Figure 4.9). The core occupies an area from the Sun’s center to about a quarter of the star’s radius. At its core, gravity pulls all the Sun's mass inward, creating intense pressure. This pressure is high enough to cause the fusion of atomic masses.
For each second of the solar nuclear fusion process, 700 million tons of hydrogen are converted into the heavier atom helium. Since its formation 4.6 billion years ago, the Sun has used up about half of the hydrogen found in its core. The nuclear fusion process also produces immense heat, causing atoms to emit photons. Temperatures at the core are about 15 million Kelvins (15 million °C or 27 million °F). Each created photon travels about one micrometer before being absorbed by an adjacent gas molecule. This absorption then heats the neighboring atom, which then reemits another photon that travels a short distance before being absorbed by another atom. This process repeats itself many times before the photon can finally be emitted into outer space at the Sun’s surface. During the last 20% of the journey to the surface, energy is transported primarily by convection rather than by radiation. It takes a photon approximately 100,000 to 200,000 years, or about 1025 absorptions and reemissions, to journey from the core to the Sun’s surface. The trip from the Sun’s surface to the Earth takes about 8 minutes.
The surface of the Sun that radiates is called the photosphere. The photosphere has an average temperature of about 5800 K (5527°C or 9981°F). Some of the Sun's emitted electromagnetic radiation occurs in the visible band centered at 0.5 µm. The total energy emitted from the Sun's surface is approximately 64,000,000 Wm-2 (watts per square meter). The radiation emitted by the Sun travels through space until it is intercepted by planets and other celestial objects. The distance the solar radiation has traveled determines how intense the light will be when it strikes these objects. We can model this process using the Inverse Square Law (Figure 4.10). This law simply states that the intensity of solar radiation (I) varies inversely with the square of the distance (d) from the Sun. As a result of this law, if the intensity of radiation at a given distance is one unit, the intensity will become only one-quarter at twice the distance. At three times the distance, the intensity will become only one-ninth of its initial intensity at a distance of one unit, and so on.
Given the amount of energy radiated by the Sun and the average Earth-Sun distance of 149.6 million km, the amount of radiation intercepted by the atmosphere's outer limits can be calculated to be around 1361 Wm-2. For general purposes, the Sun's energy output can be considered unvarying and is consequently known as thesolar constant. This idea is not entirely correct. Satellite measurements have shown that the Sun's output is quite variable on timescales of less than a few years (Figure 4.11). Researchers have also speculated that the colder global temperatures during the Little Ice Age (1550-1850 CE) may have been caused by a decrease in solar radiation. This hypothesis, however, is difficult to prove because accurate data on solar radiation output only go back to about 1980.
Sunspots, Prominences, and Solar Flares
The Sun’s photosphere also contains dark sunspots that have a temperature several hundred degrees K cooler than the rest of the photosphere (Figure 4.12). Sunspots always occur in pairs, with the two spots connected by intense magnetic fields originating from the Sun’s interior. Researchers have found that the number of sunspots on the Sun tends to vary cyclically over time (Figure 4.13). This cycle has been measured to have an average period of about 11 years. Scientists also believe that the cycling of sunspots may be associated with changes in the Earth’s climate. We will examine this relationship in greater depth later on in the eBook.
Sunspots can also produce prominences and solar flares (Figure 4.9). Prominences are clouds of gas that can extend into space by 50,000 km or more. These features can persist for 2 to 3 months. A solar flare is a violent explosion on the Sun that releases gas, electrons, visible light, ultraviolet light, and X-rays into space. Some of the radiation and particles ejected by solar flares can reach our planet’s magnetic field. This meeting produces the Earth’s Aurora Borealis (Northern Lights) and Aurora Australis (Southern Lights) in the upper atmosphere (Figure 4.14). Solar flares can also disrupt Earth-based radio communications, satellite transmissions, and cause power surges and even blackouts in power-line grids.

FIGURE 4.9 Major parts of the Sun. Solar energy is produced at the core of the Sun by nuclear fusion. This energy is then radiated into the convection zone, where dynamic mixing transfers it to the photosphere. The photosphere is the surface that emits solar radiation to space and our planet. On the photosphere, localized cool areas called sunspots occur. Erupting from the photosphere are solar flares composed of gas, electrons, and radiation. The corona is the upper portion of the Sun’s atmosphere. Image Copyright: Michael Pidwirny.

FIGURE 4.10 According to the Inverse Square Law, the diffusion of radiation is geometrically related to the distance traveled. In the given equation,Kis the radiation intensity at a distance of 1 unit (1d). At two unit distances (2d), the intensity of the radiation is determined by dividingKby the square of the new distance from the source. The same procedure determines the intensity at distances of 3 units from the source. Image Copyright: Michael Pidwirny.
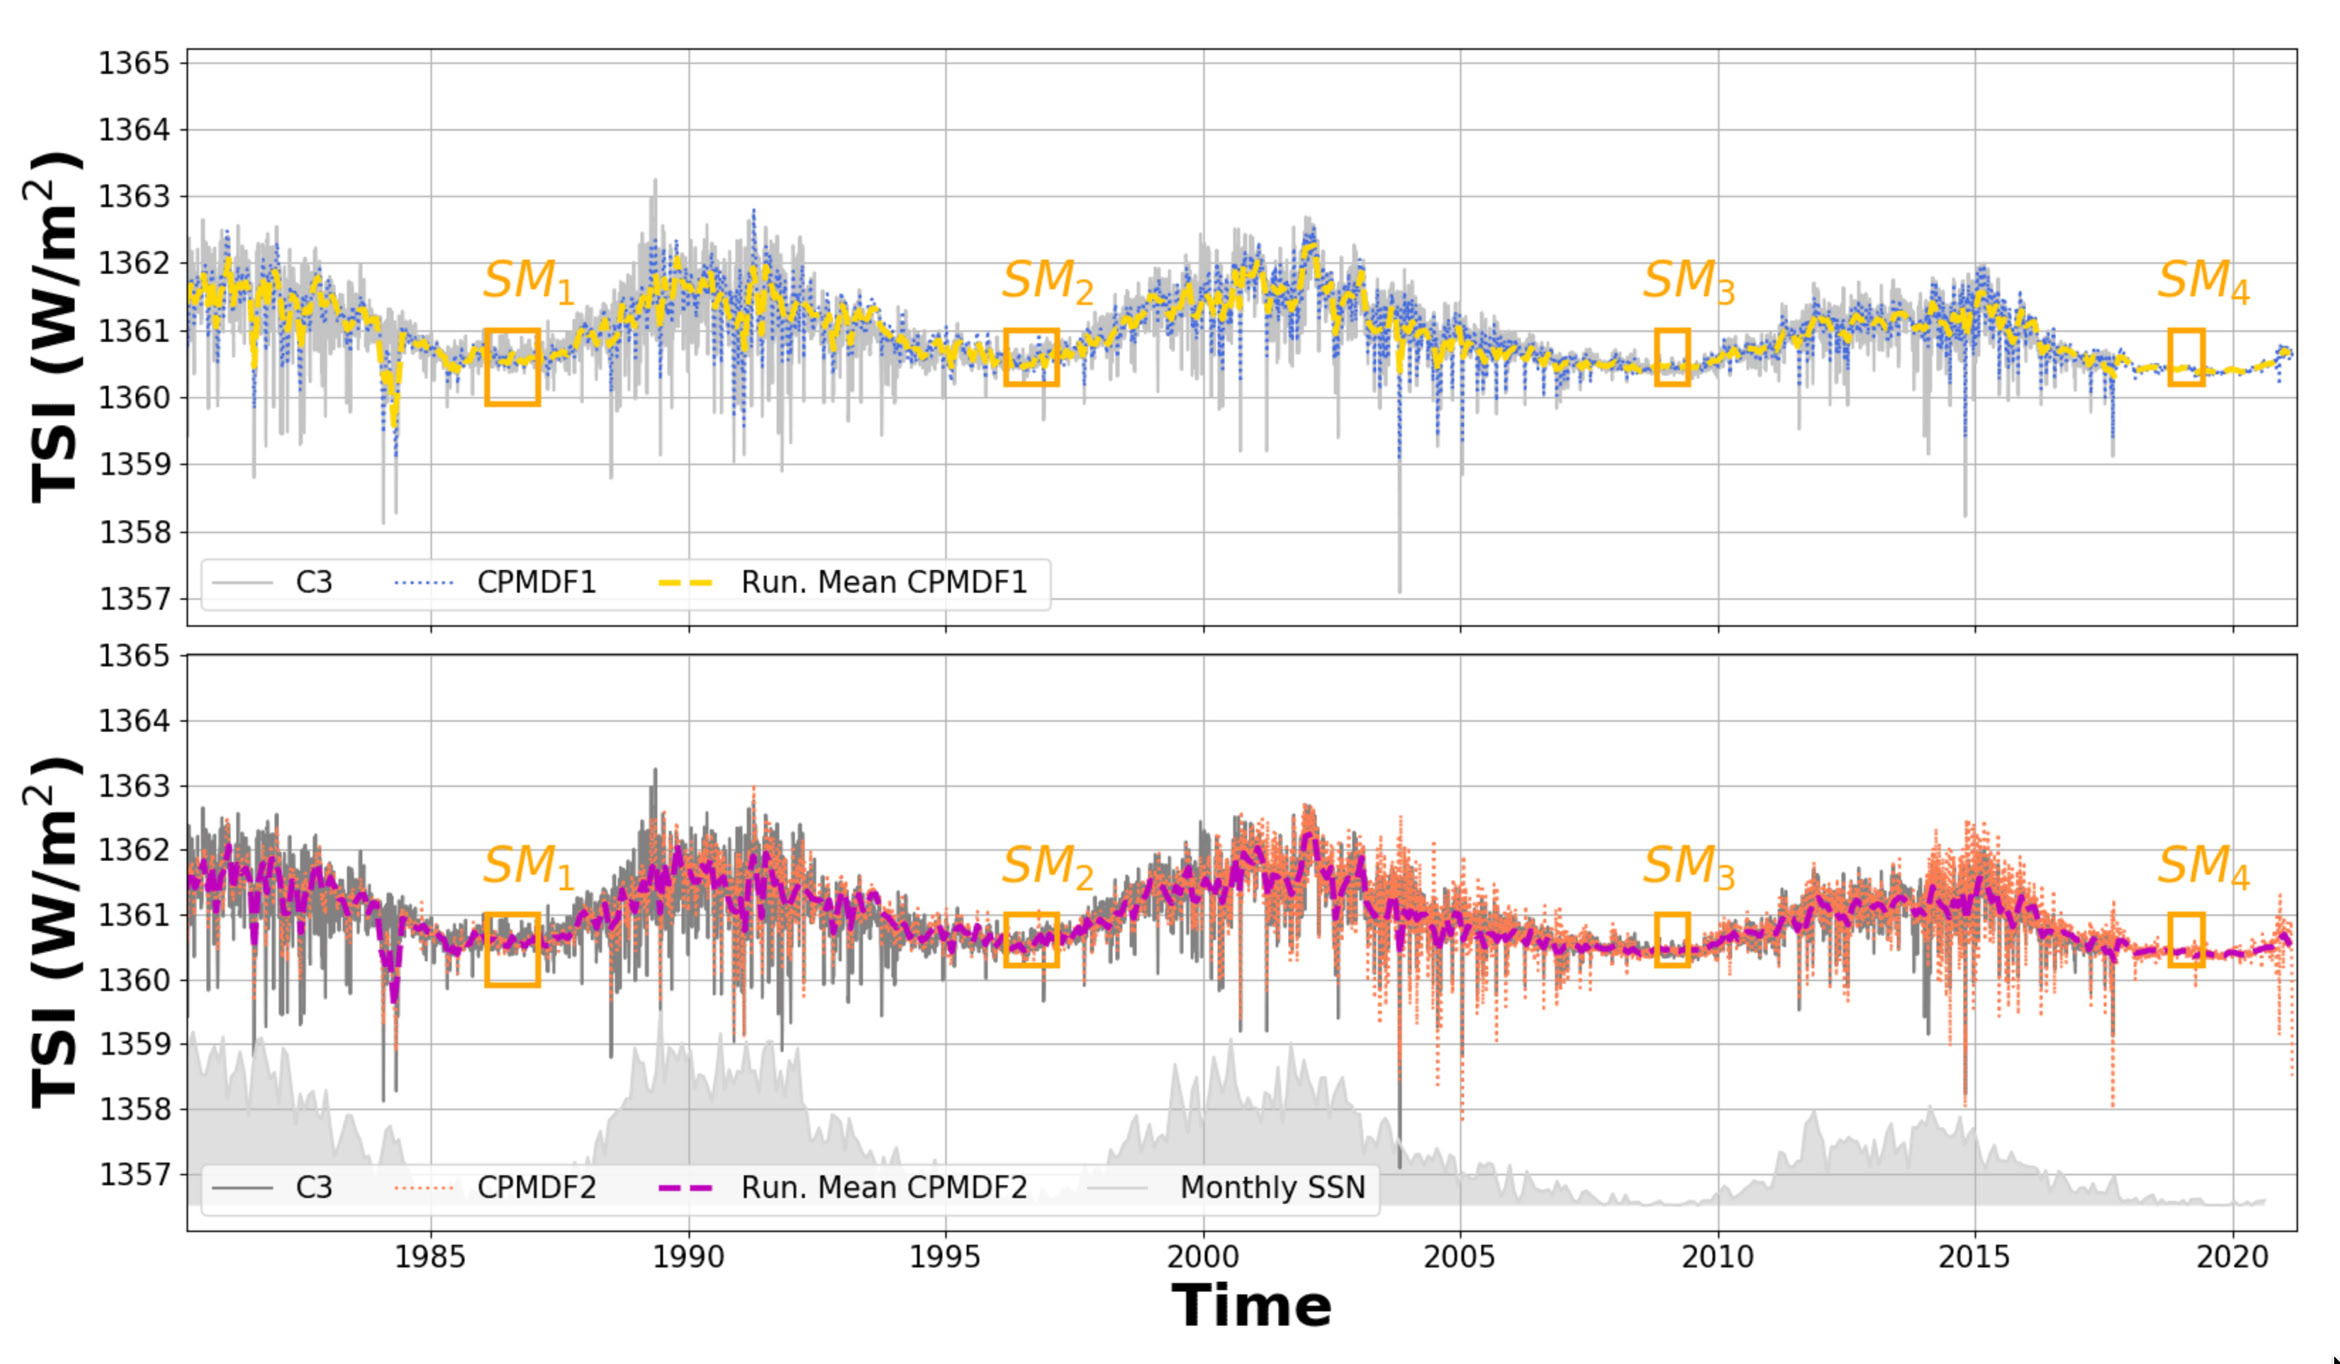
FIGURE 4.11 Measurements of solar irradiance outside the Earth's atmosphere from various independent space-based radiometers from 1980 to 2021. This data has been recalibrated and combined to produce two composites (top graph CPMDF1, blue without and with a wavelet filter bottom graph CPMDF2, orange) of total solar irradiance (TSI - W/m2). These graphs indicate that the Sun's output varies by about 0.1 percent with the 11-year sunspot cycle. Temporary drops (a few days) in output of up to 0.3 percent result from large sunspots passing over the visible region of the Sun. The 11-year peak in sunspot numbers is accompanied by an increase in magnetic activity, leading to a general rise in radiation output. This increase in radiation production exceeds the isolated cooling effects of the sunspots. Image Source: Physikalisch-Meteorologisches Observatorium Davos, World Radiation Center.
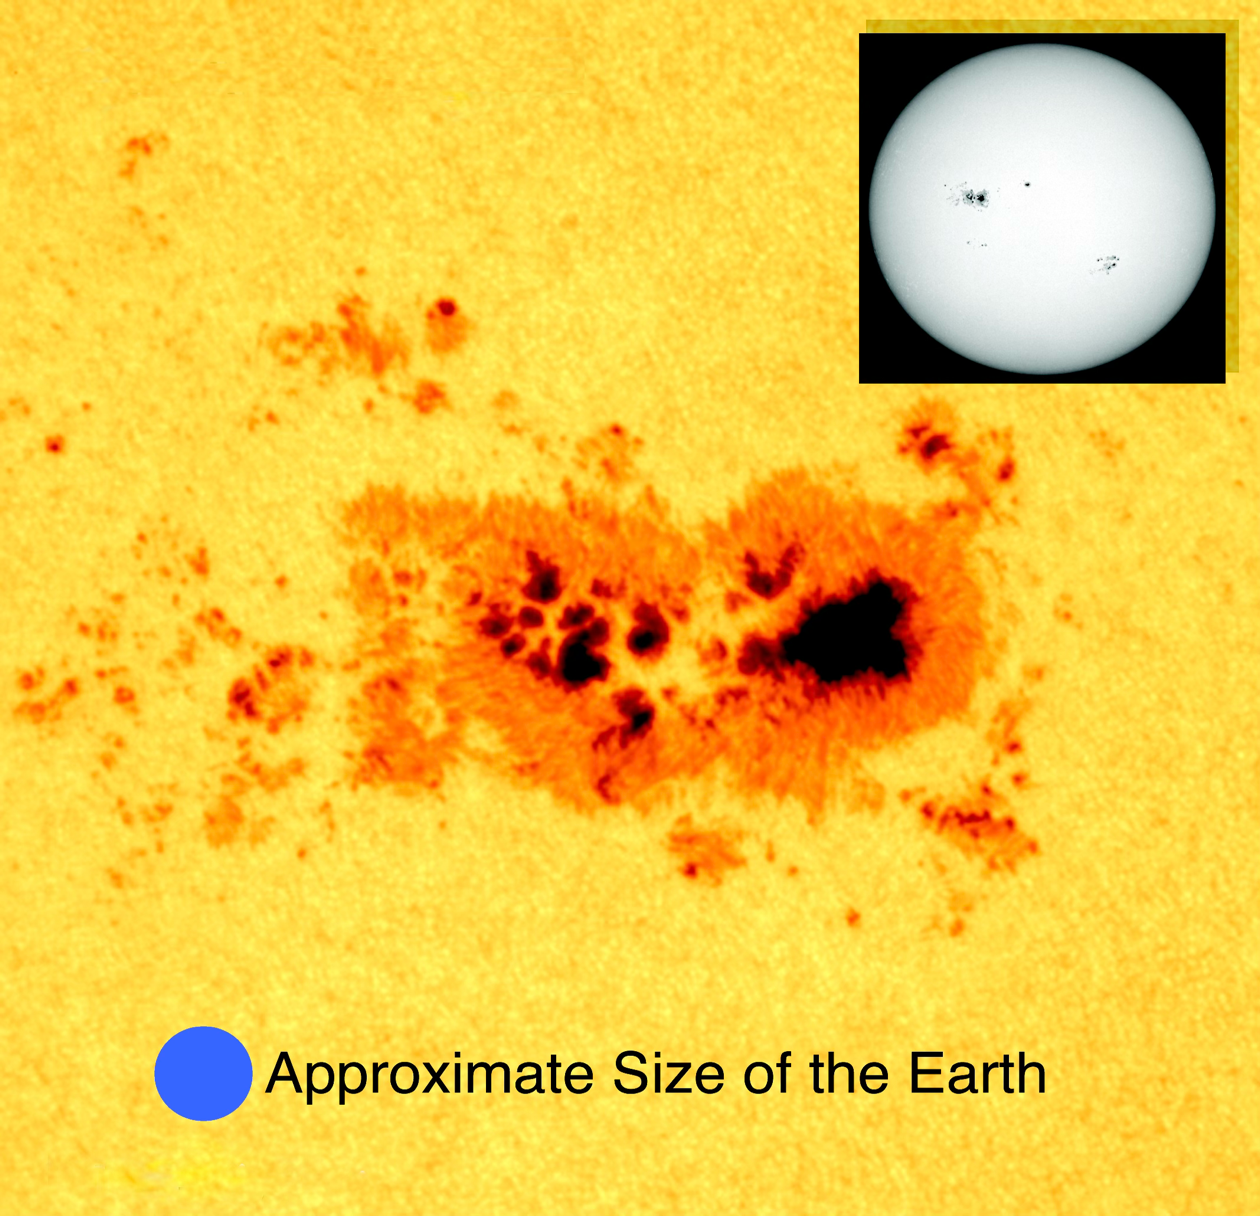
FIGURE 4.12 A large sunspot group observed on September 23, 2000. This group of sunspots covered an area a dozen times larger than the entire surface of the Earth. Sunspots are caused by intense magnetic fields emerging from the Sun’s interior. Image Source: NASA - Solar and Heliospheric Observatory.
FIGURE 4.13 Monthly mean sunspot numbers from July 1749 to November 2022. Sunspots form with a somewhat regular pattern over time. Peak sunspot numbers usually occur on average about every 11 years. Image Copyright: Michael Pidwirny, Data Source: Solar Influences Data Analysis Center - Royal Observatory of Belgium.
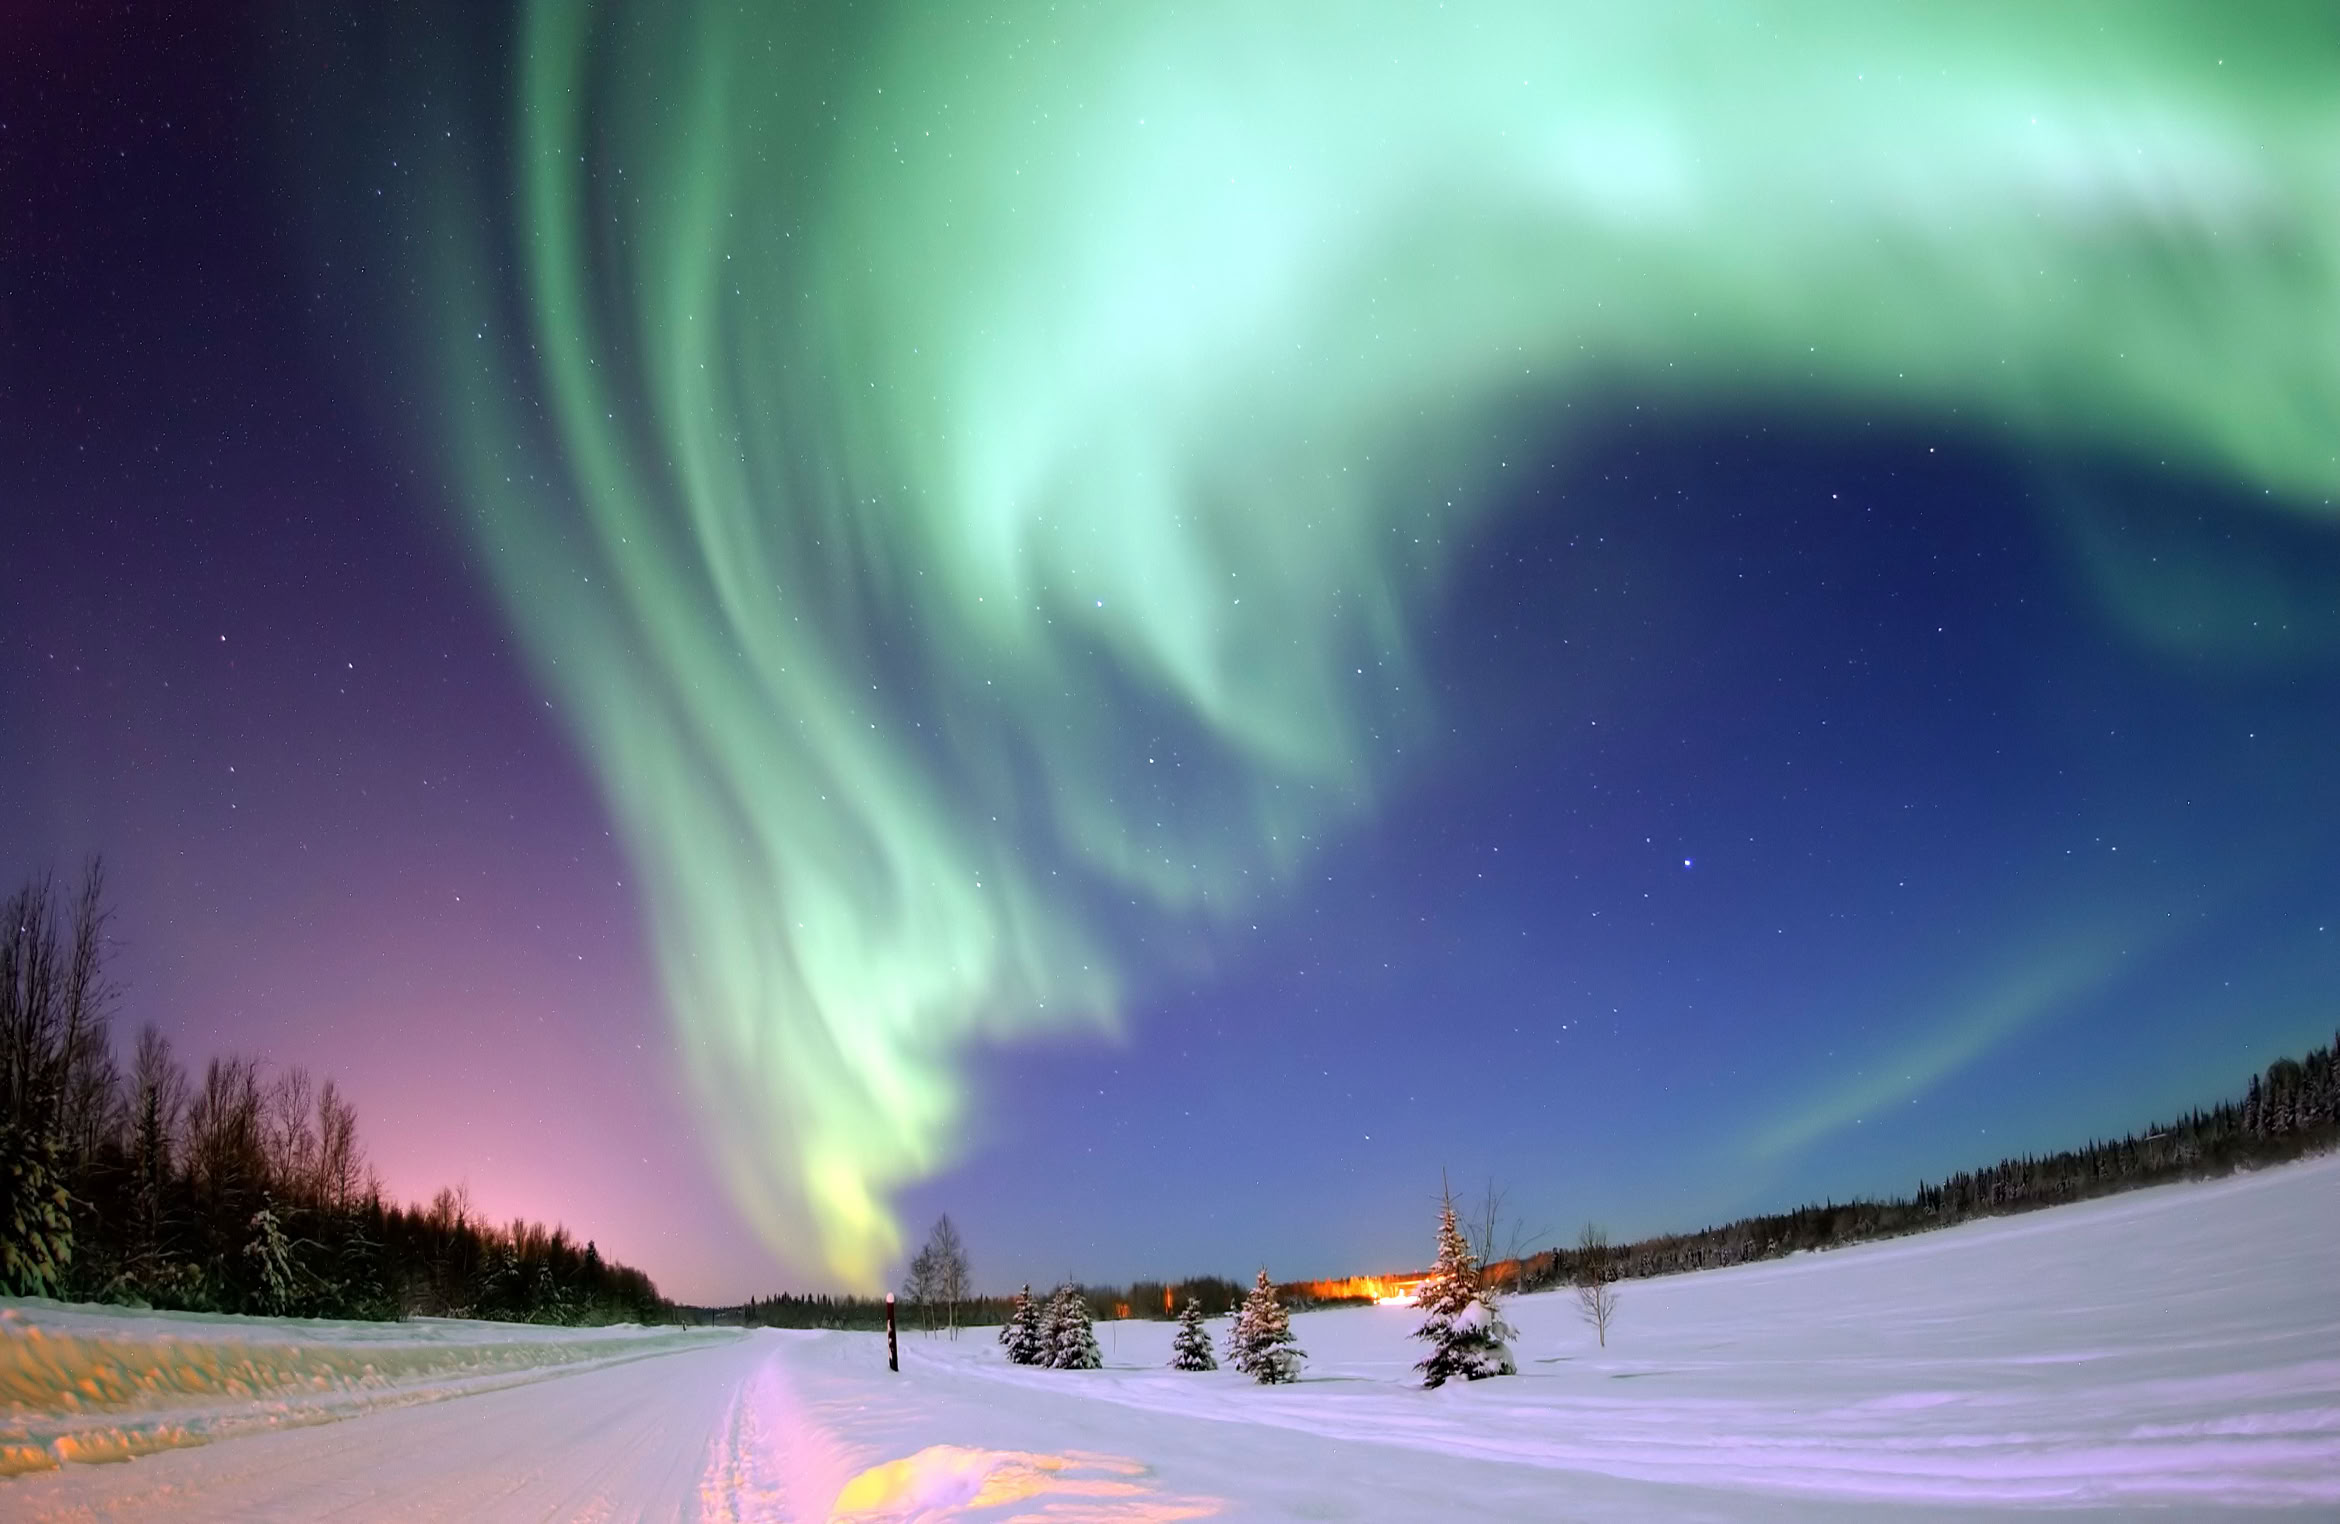
FIGURE 4.14 Aurora Borealis, or Northern Lights, above Bear Lake, Alaska. Auroral activity is caused by the interaction of atomic oxygen in the upper atmosphere with the Van Allen Radiation Belts. Auroras are most commonly seen at locations poleward of 65°N and 65°S during spring and fall seasons. Image Source: Wikipedia, photo by Joshua Strang, United States Air Force.