FIGURE 7.36 Satellite view of the atmospheric circulation around the South Pole. The spiraling waves of clouds circling around Antarctica are mid-latitude cyclones. Image Source: NASA - Astronomy Picture of the Day.

Horizontal patterns of atmospheric circulation above the Earth's surface vary with elevation. In the troposphere, the upper-atmosphere flow is poleward, with a predominant west-to-east direction. Because of the directional consistency of these winds, they are commonly called the Upper Air Westerlies. The Upper Air Westerlies form because air pressure is generally higher over the equatorial regions and lower over the Earth's polar regions. Consequently, this spatial configuration causes the development of a global-scale pressure gradient. Pressure gradient force then moves air aloft from the equator to the poles. The strong west-to-east component of this airflow is caused by the deflection imparted on the moving air by the Coriolis effect. Because friction is minimal in the upper atmosphere, deflection is greatest, causing winds there to flow roughly parallel to the isobars.
The Upper Air Westerlies are quite dominant from 20 to 80° North and South of the equator (Figure 7.33). Within this region of the atmosphere, there are also two narrow zones in each hemisphere where the Upper Air Westerlies become extremely fast. These zones are known as jet streams. In these narrow regions of the Upper Air Westerlies, wind speeds accelerate because of the local presence of steep pressure gradients. Figure 7.34 shows the relative position of the jet streams in each hemisphere. Note that these meandering bands of fast-moving air are unbroken and circle the entire planet.
The best-known jet stream is the Polar Jet Stream. This jet stream was discovered around World War II when airplanes began flying at higher altitudes. American pilots flying bombing missions to Japanese-occupied Pacific islands occasionally encountered these winds on their flights. This encounter often caused the planes to make little headway when flying westward (into the prevailing jet stream winds). On return flights (eastward in direction) back to the U.S. bases, flight speeds would be accelerated because of strong tailwinds produced by the jet stream. The Polar Jet Stream occurs in the middle latitudes at altitudes of 8 to 12 km (5-7.5 mi). The width of the Polar Jet Stream varies between 100 and 500 km (60 and 300 mi). Vertical thickness is usually between 1000 and 2000 m (3250 and 6500 ft). Wind speeds at this feature's core are often more significant than 200 kph (120 mph). Maximum speeds can occasionally reach 400 kph (240 mph). The jet stream core is surrounded by a zone of slower-moving air with an average velocity of 75 to 125 kph (45 to 78 mph).
On an upper-air weather chart, the Polar Jet Stream resembles a meandering stream transporting large quantities of air from west to east. Analyzing upper-air weather charts over the course of 1 year reveals that the Polar Jet Stream exhibits significant daily and seasonal variations in its position. In the winter months, the polar stream shifts its average position in a southerly direction. At the peak of winter, the Polar Jet Stream can occasionally influence locations at 30° latitude (for example, northern Mexico and Florida). The Polar Jet Stream migrates towards the poles during the spring and summer months. The average position of the Polar Jet Stream during the summer months is about 55° latitude (north of the Canada/USA border).
Associated with the Polar Jet Stream is the Polar Front. The Polar Front represents the transitional zone where warm air from the subtropics and cold air from the poles meet (Figure 7.35). In this zone, massive energy exchanges occur as cyclonic storms known as mid-latitude cyclones. The shape and position of waves in the Polar Jet Stream determine the location and the intensity of the mid-latitude cyclones. In general, mid-latitude cyclones form beneath Polar Jet Stream troughs. The following satellite image (Figure 7.36), taken from above the South Pole, shows several mid-latitude cyclones circling Antarctica. The cloud development associated with frontal uplift defines each mid-latitude cyclone wave.
The Subtropical Jet Stream lies approximately 13 km (8 mi) above the Subtropical High Pressure Zone. Its formation is similar to that of the Polar Jet Stream: it develops from a localized steep pressure gradient in the upper atmosphere. The Subtropical Jet Stream differs from the Polar Jet Stream in two distinct ways. First, the Subtropical Jet Stream has generally lower wind speeds. During the summer season, the velocity of the Subtropical Jet Stream can drop to a point where the feature blends in with the surrounding Upper Air Westerlies. This condition can last for several days. Second, the Subtropical Jet Stream tends to exhibit less day-to-day and seasonal variation in its latitudinal position. Sometimes in the winter and early spring, the Subtropical Jet Stream can join with the Polar Jet Stream. These mergers are mainly due to the migration of the Polar Jet Stream into areas where the Subtropical Jet Stream normally exists.
Rossby Waves
It is essential to recognize that the Polar Jet Stream is a connected part of a much bigger airflow: the Upper Air Westerlies (Figure 7.37). Because of this connection, undulations in the Polar Jet Stream indicate much larger waves in global atmospheric circulation. Another name for these large waves in the upper atmosphere isRossby waves, named after meteorologist C.G. Rossby, who studied this atmospheric feature in the 1930s.
Most of our knowledge about the nature of Rossby waves comes from the research work of C.G. Rossby. Typically, there are between three to seven Rossby waves circling the planet at any time. The characteristics of individual waves in this atmospheric system can vary considerably in terms of wavelength (the distance between adjacent wave ridges or troughs), amplitude (the latitudinal extent), and internal wind speeds (Figure 7.38). Variations in Rossby wave number tend to correlate with seasonal variations in climate. During winter, latitudinal temperature extremes generally produce fewer waves with greater amplitudes and stronger associated winds. Summer is associated with more waves, lower amplitudes, and weaker upper-air winds.
Rossby waves can significantly influence daily weather in middle- and high-latitude regions. The development of waves in this system indicates the movement of warm subtropical air poleward and cold polar air towards the equator. This redistribution of cold and warm air can cause drastic changes in the weather when waves move into an area.

FIGURE 1 Annual average wind speed and direction at the 250 millibar level, 1991-2020. The 250 millibar level represents an altitude of about 10,500 to 11,000 meters (34,450 feet to 36,900). Longer arrows indicate faster winds – see legend colors for speeds in meters per second. Image Source: Climate Reanalyzer (https://climatereanalyzer.org), Climate Change Institute, University of Maine, USA. The dataset used for this map is ECMWF European Reanalysis V5 (ERA5) [0.5°x0.5°].
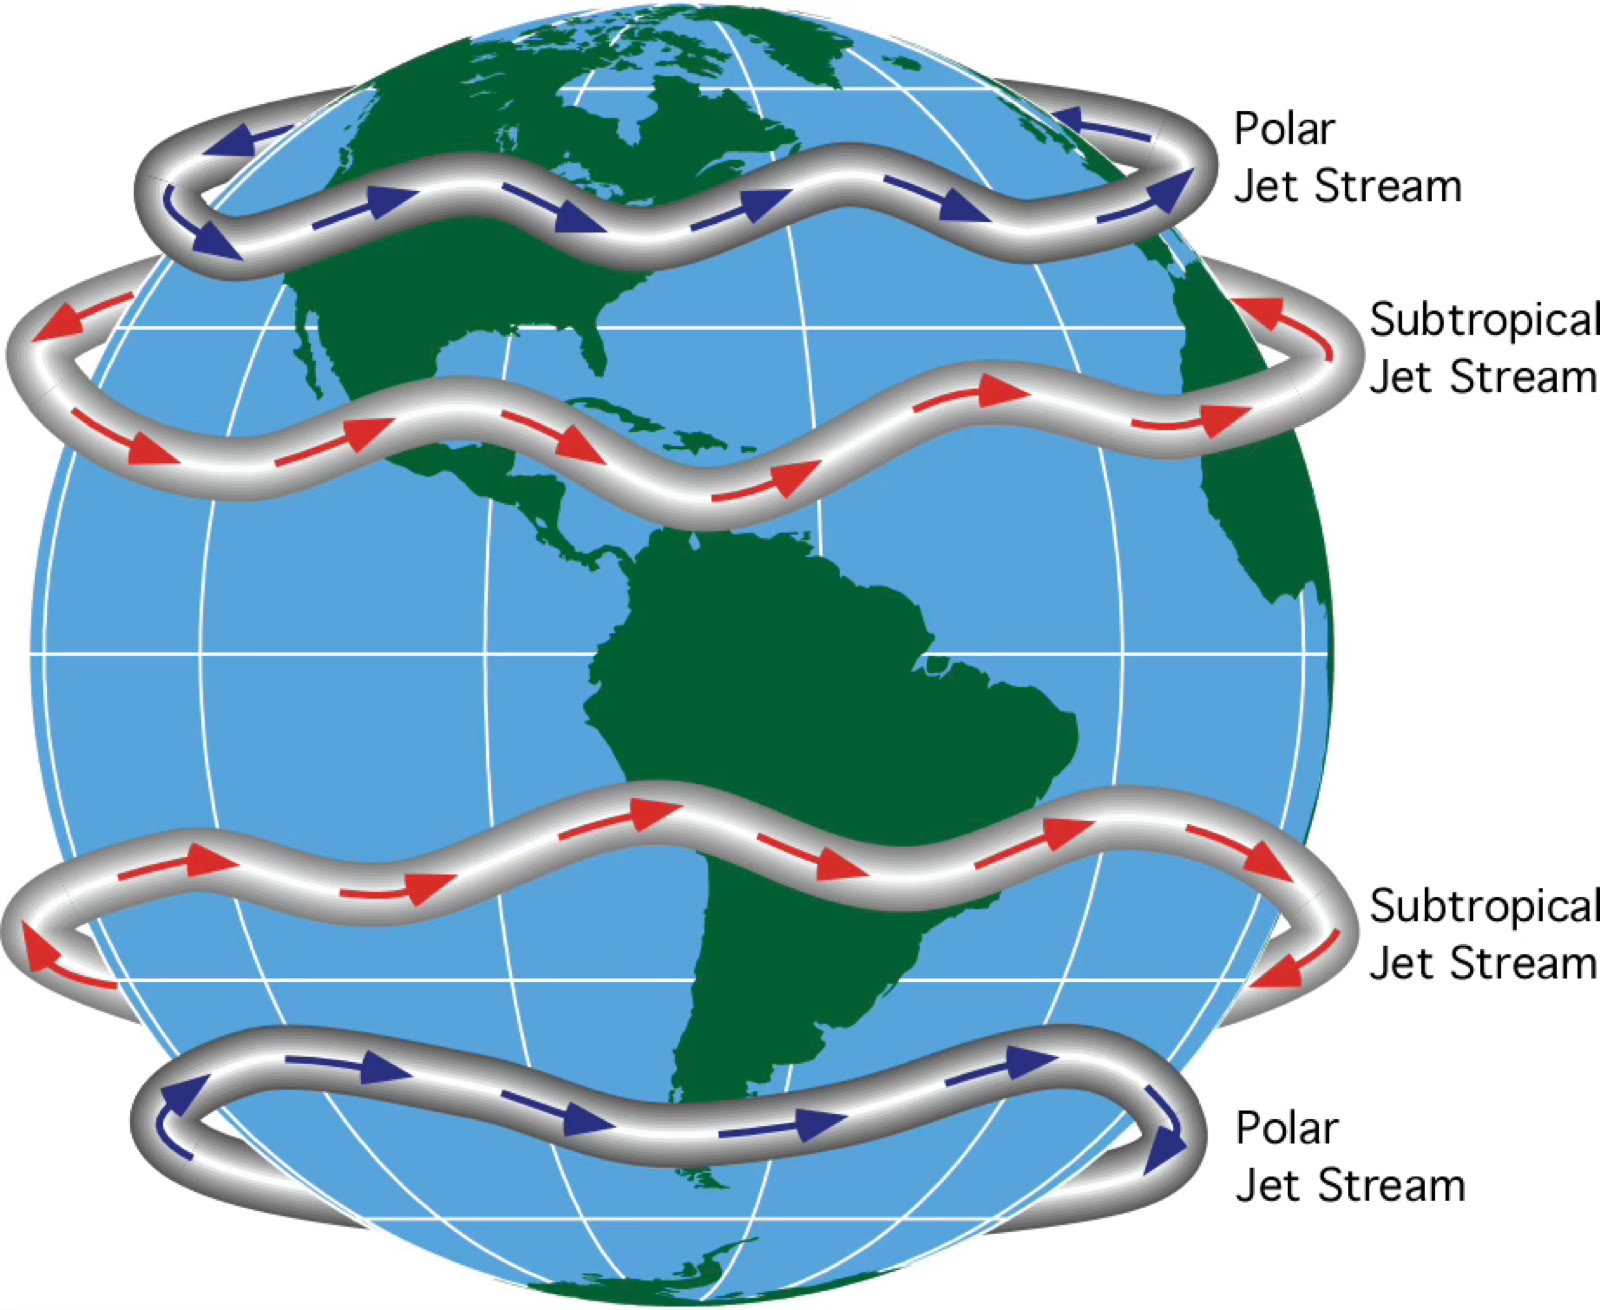
FIGURE 7.34 The Polar and Subtropical Jet Streams locations. Image Copyright: Michael Pidwirny.
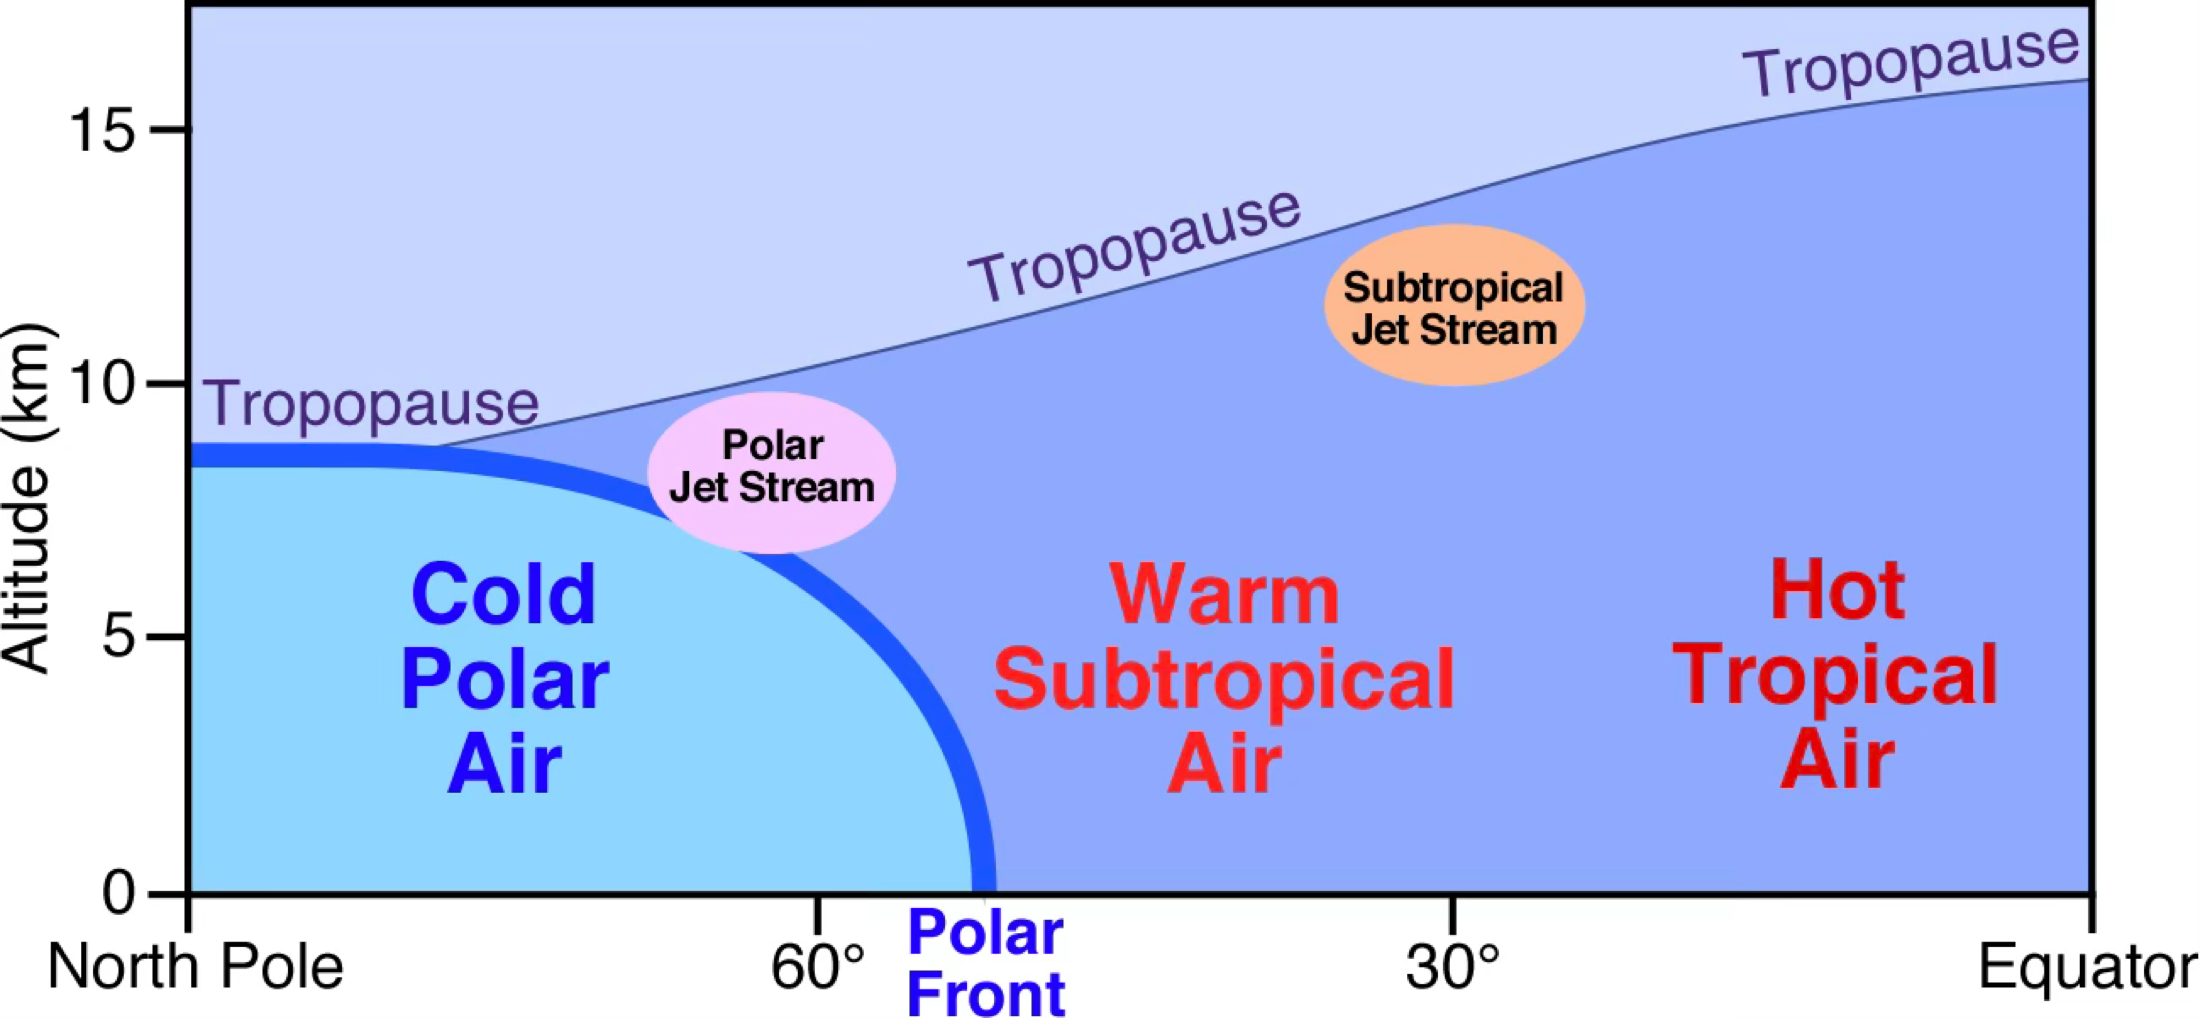
FIGURE 7.35 A vertical cross-section of the atmosphere from the North Pole to the equator shows the Polar Front's relative location and the Polar Jet Stream. The Polar Front is a transition zone where cold polar air and warm subtropical air meet. Image Copyright: Michael Pidwirny.

FIGURE 7.37 Scientific visualization showing a polar view of the position of the Polar Jet Stream on May 24, 2010. In this graphic, the speed of the upper-air winds is shown by color. The zones colored red, orange, and yellow are the fastest winds and make up the Polar Jet Stream. Undulations in this weather feature can be seen in several locations. These undulations are known as Rossby waves. Image Source: NASA/Goddard Space Flight Center Scientific Visualization Studio.

FIGURE 9 Rossby waves in the upper atmosphere as defined by the Polar Jet Stream and associated upper air circulation. In illustration A, six waves exist that have relatively small amplitudes. Illustration B has only four waves that have much larger amplitudes. Because of the greater amplitudes of the much larger waves, warm air excursions towards the poles and cold air towards the equator travel greater distances. Image Copyright: Michael Pidwirny.